

Trend Fatigue

What TSF Is
A swing-trading resource that saves you time — analyzing the market and surfacing interesting opportunities and setups.
Trading education to help you build your own methodology, process, and risk-management & execution framework around sound principles.
A community with 400+ members, with a private Discord.
The TSF Analytics platform — thesetupfactory.com
What TSF Is Not
A trade-alert service. I share all of my own trades, but those are my personal trades and journaled thoughts — never a recommendation to buy or sell anything, nor is it financial advice.
Signals to act on. The setups aren’t recommendations either. Every setup has to trigger to become valid; I only share my own views on the setups and the stocks I discuss.
TSF - Focus Stocks Will Be Sent Out Tonight
To all paid subscribers — with the best setups and opportunities I see going into this week.

Lets Start With Part Of The Summary From Last Weeks Analysis
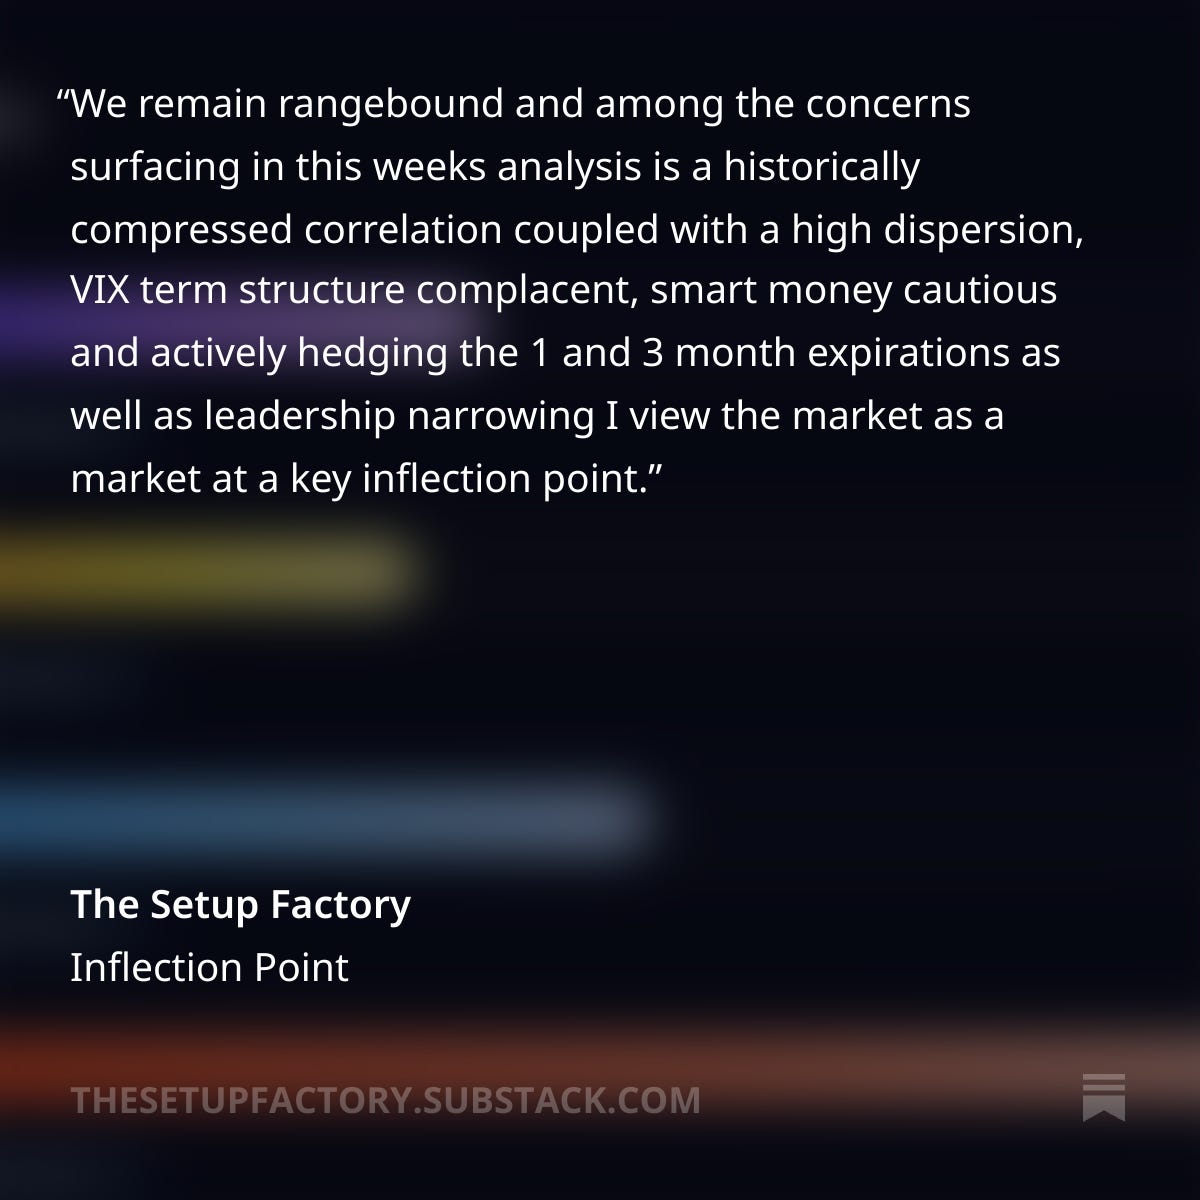

And The Market Is At A Key Inflection Point Still
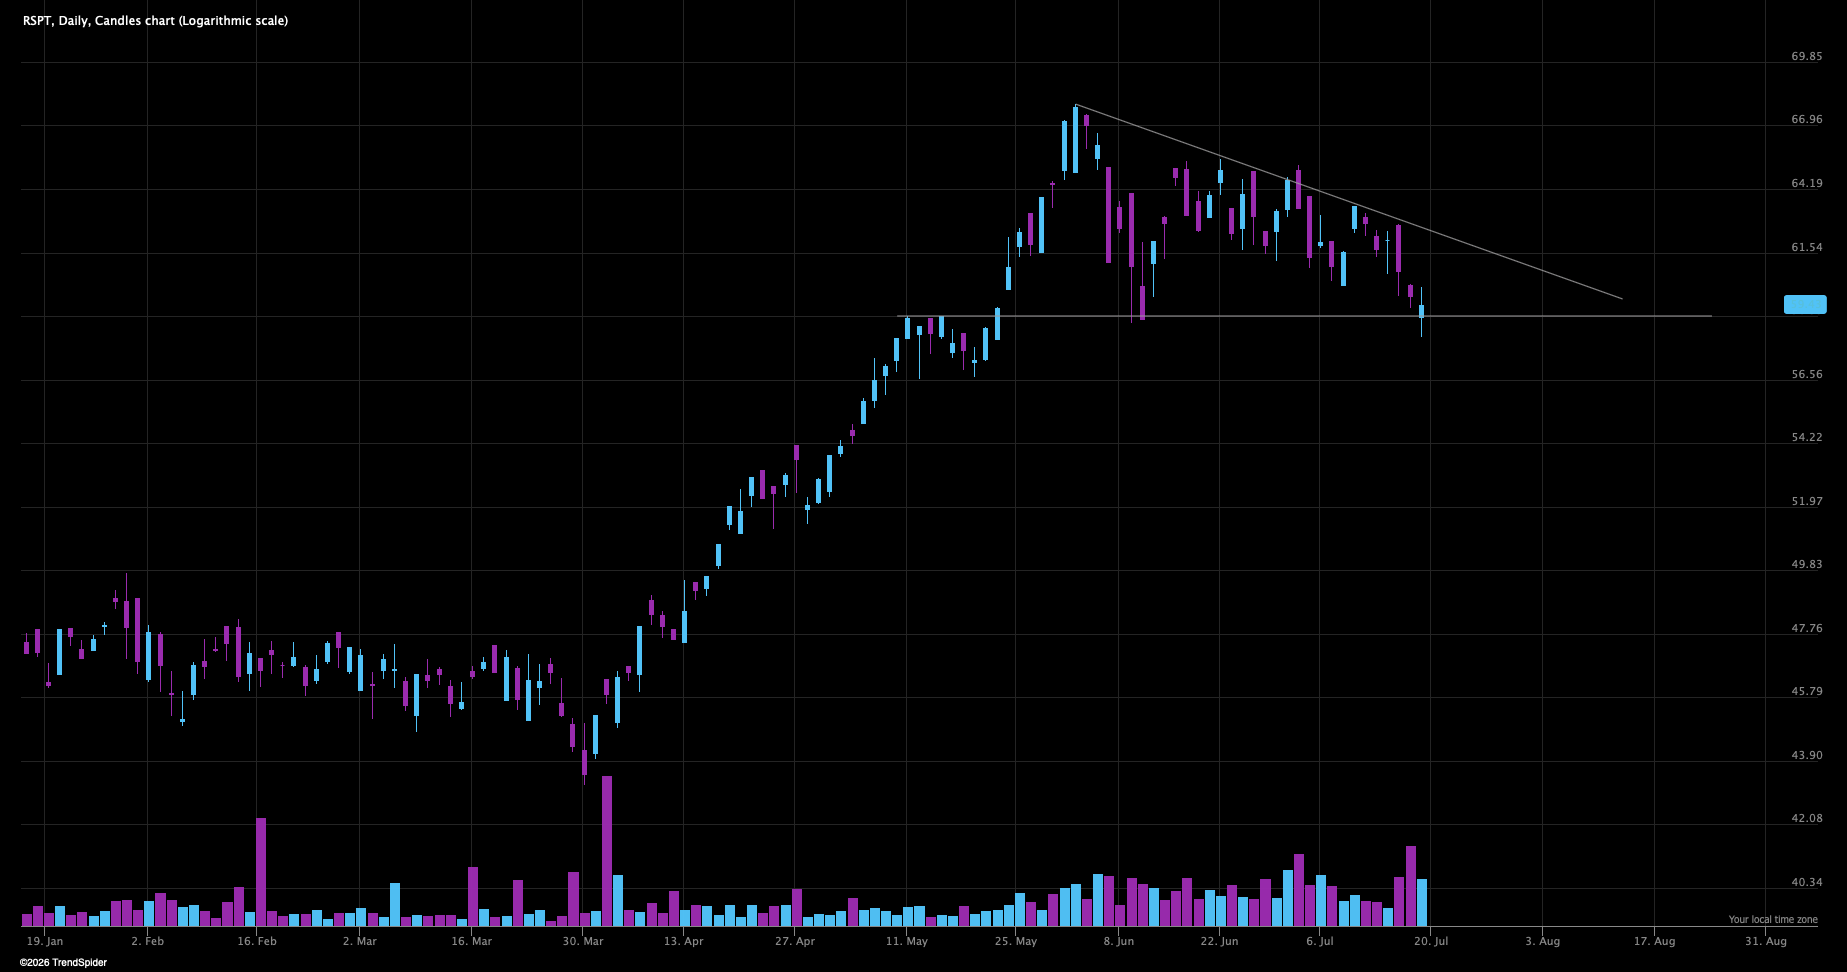
More specifically the tech sector is rolling over, here we look at equal weighted tech to give us a broader picture than QQQ.
Looks heavy and a breakdown in tech will affect other parts as well, like rotational sectors that are currently holding up well.
At the same time, wouldn’t a classic failed breakdown here really be a pain for many?
VIX Finally Came To Life
VIX popped on Thursday and Friday which pressured equities.
And a complacent VIX about to pop was one of the observations shared in last weeks analysis.
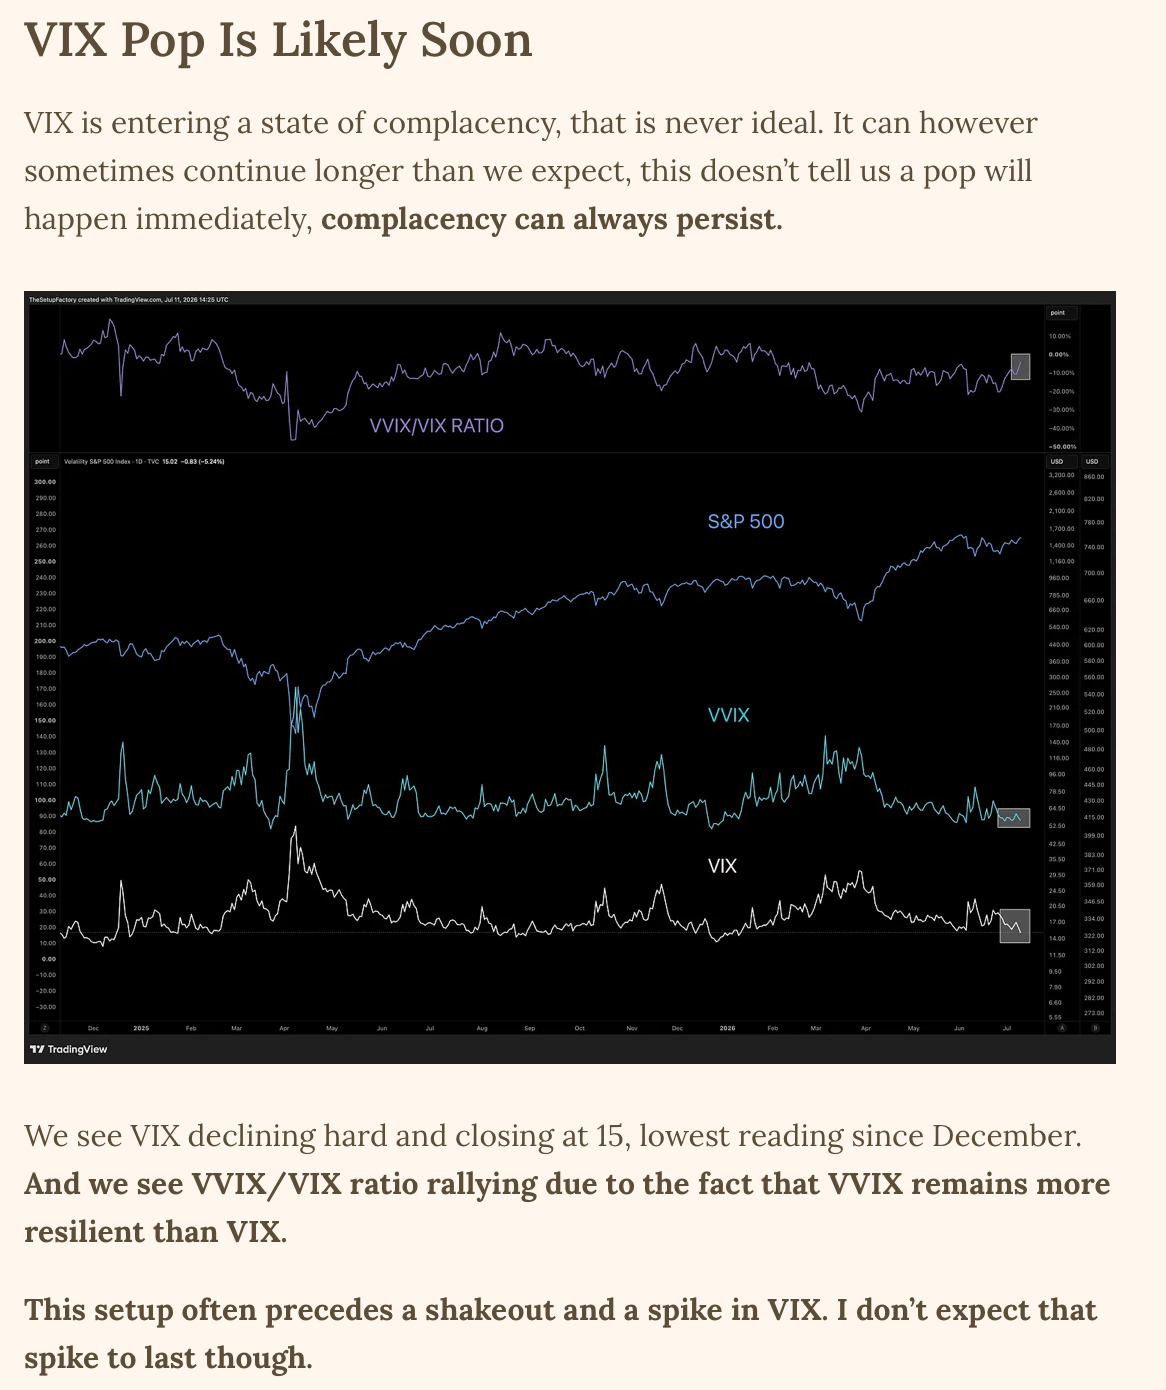
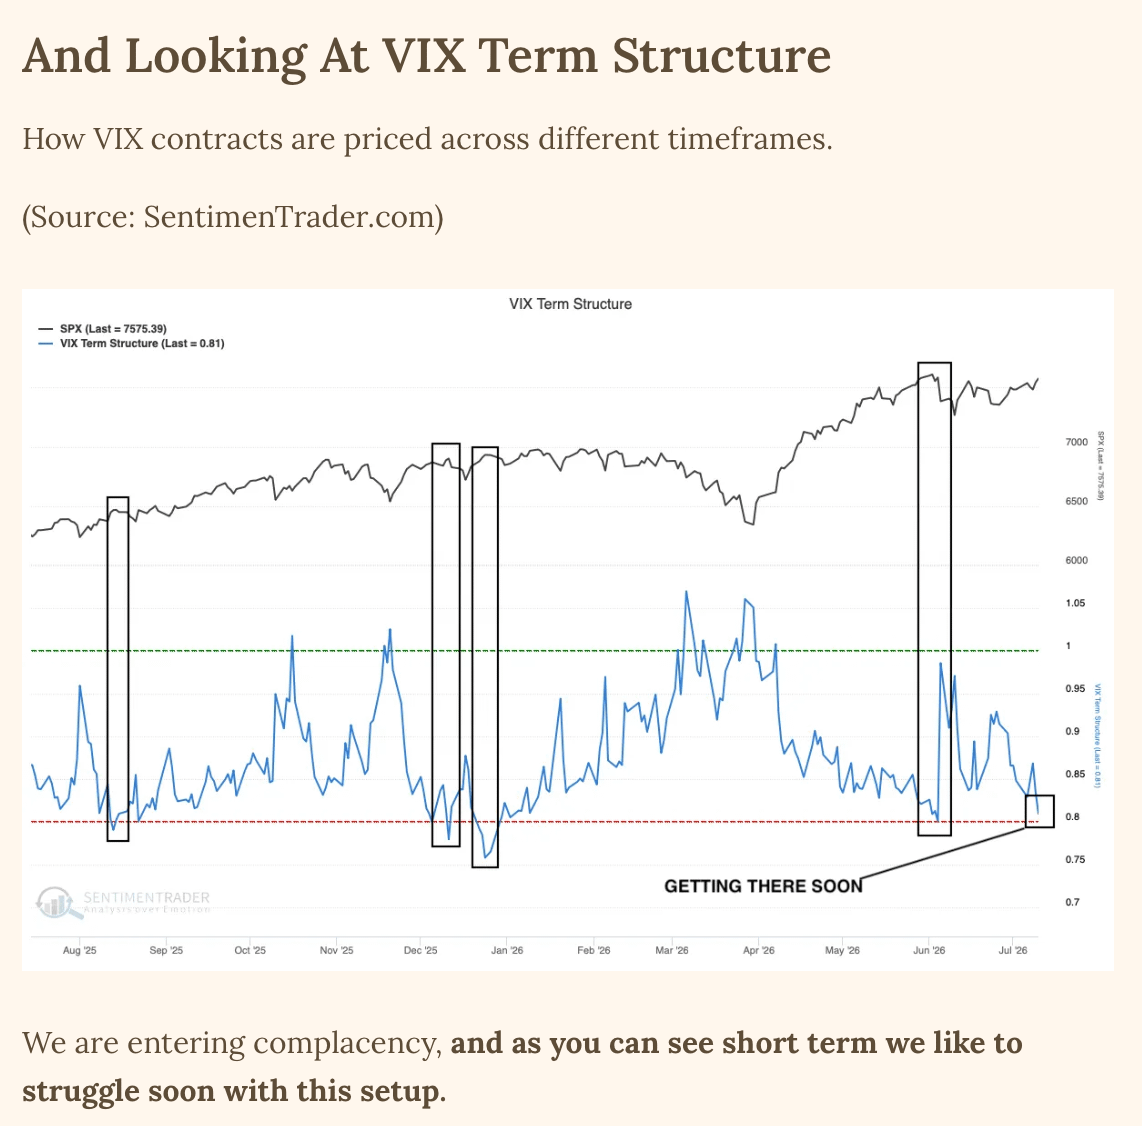
Because complacency in VIX term structure will often cap forward returns short term, until that dynamic resets.
We Still Find Ourselves In Weakening Cycle
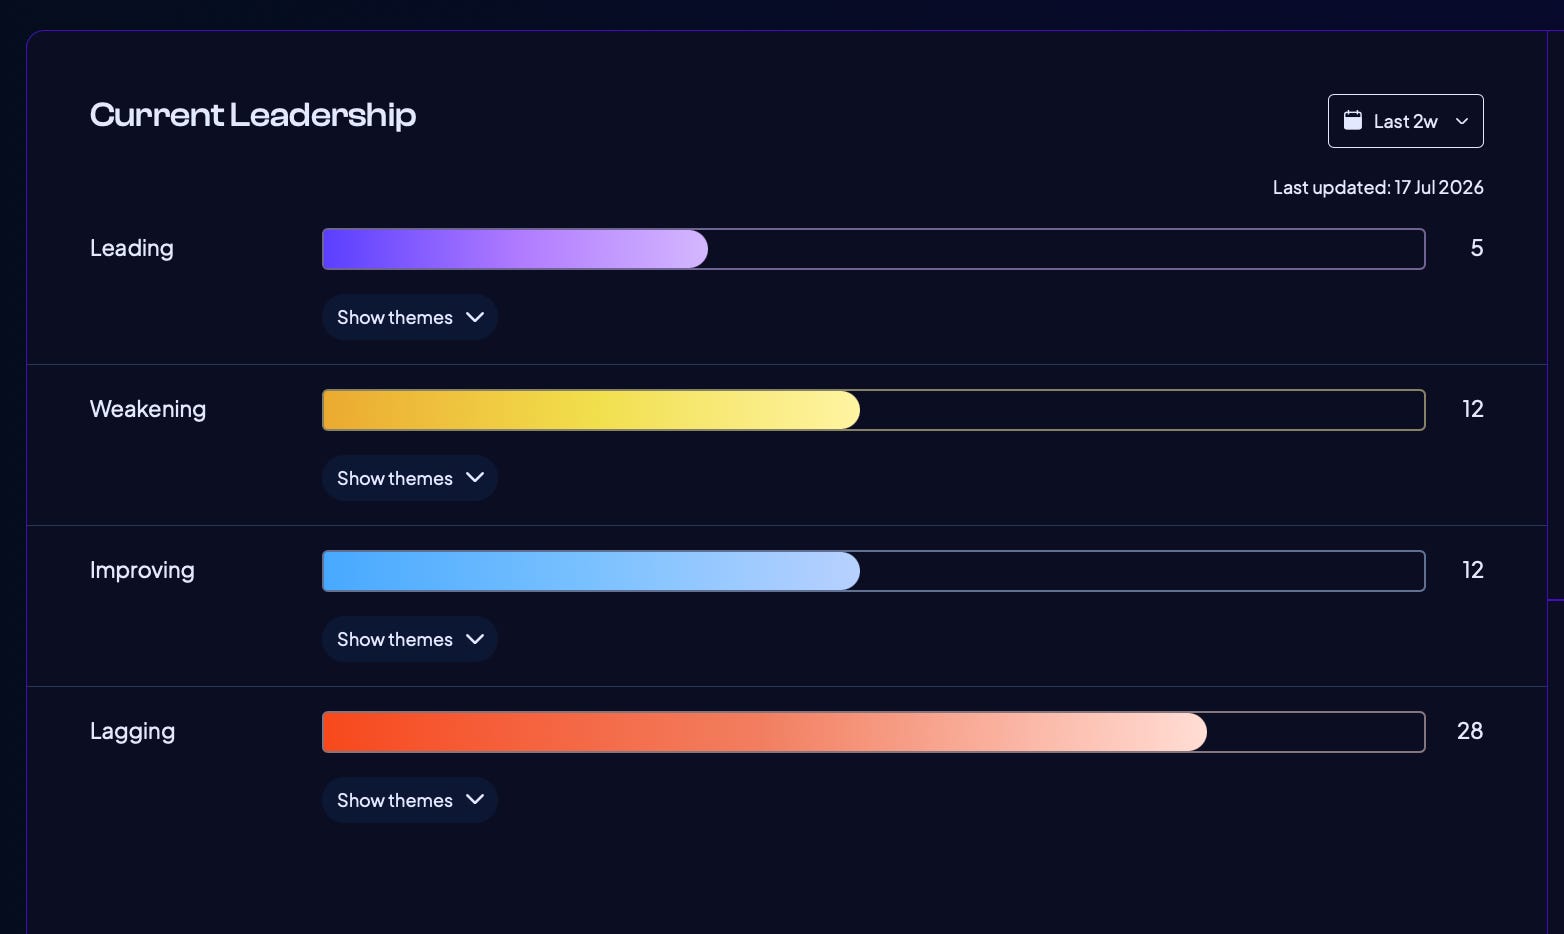
We are seeing narrowing of leadership, not expansion currently. We see a large amount of lagging groups and very few leading groups showing positive RS and RS acceleration.
Lastly Before We Start — Upgrade To TSF - Analytics
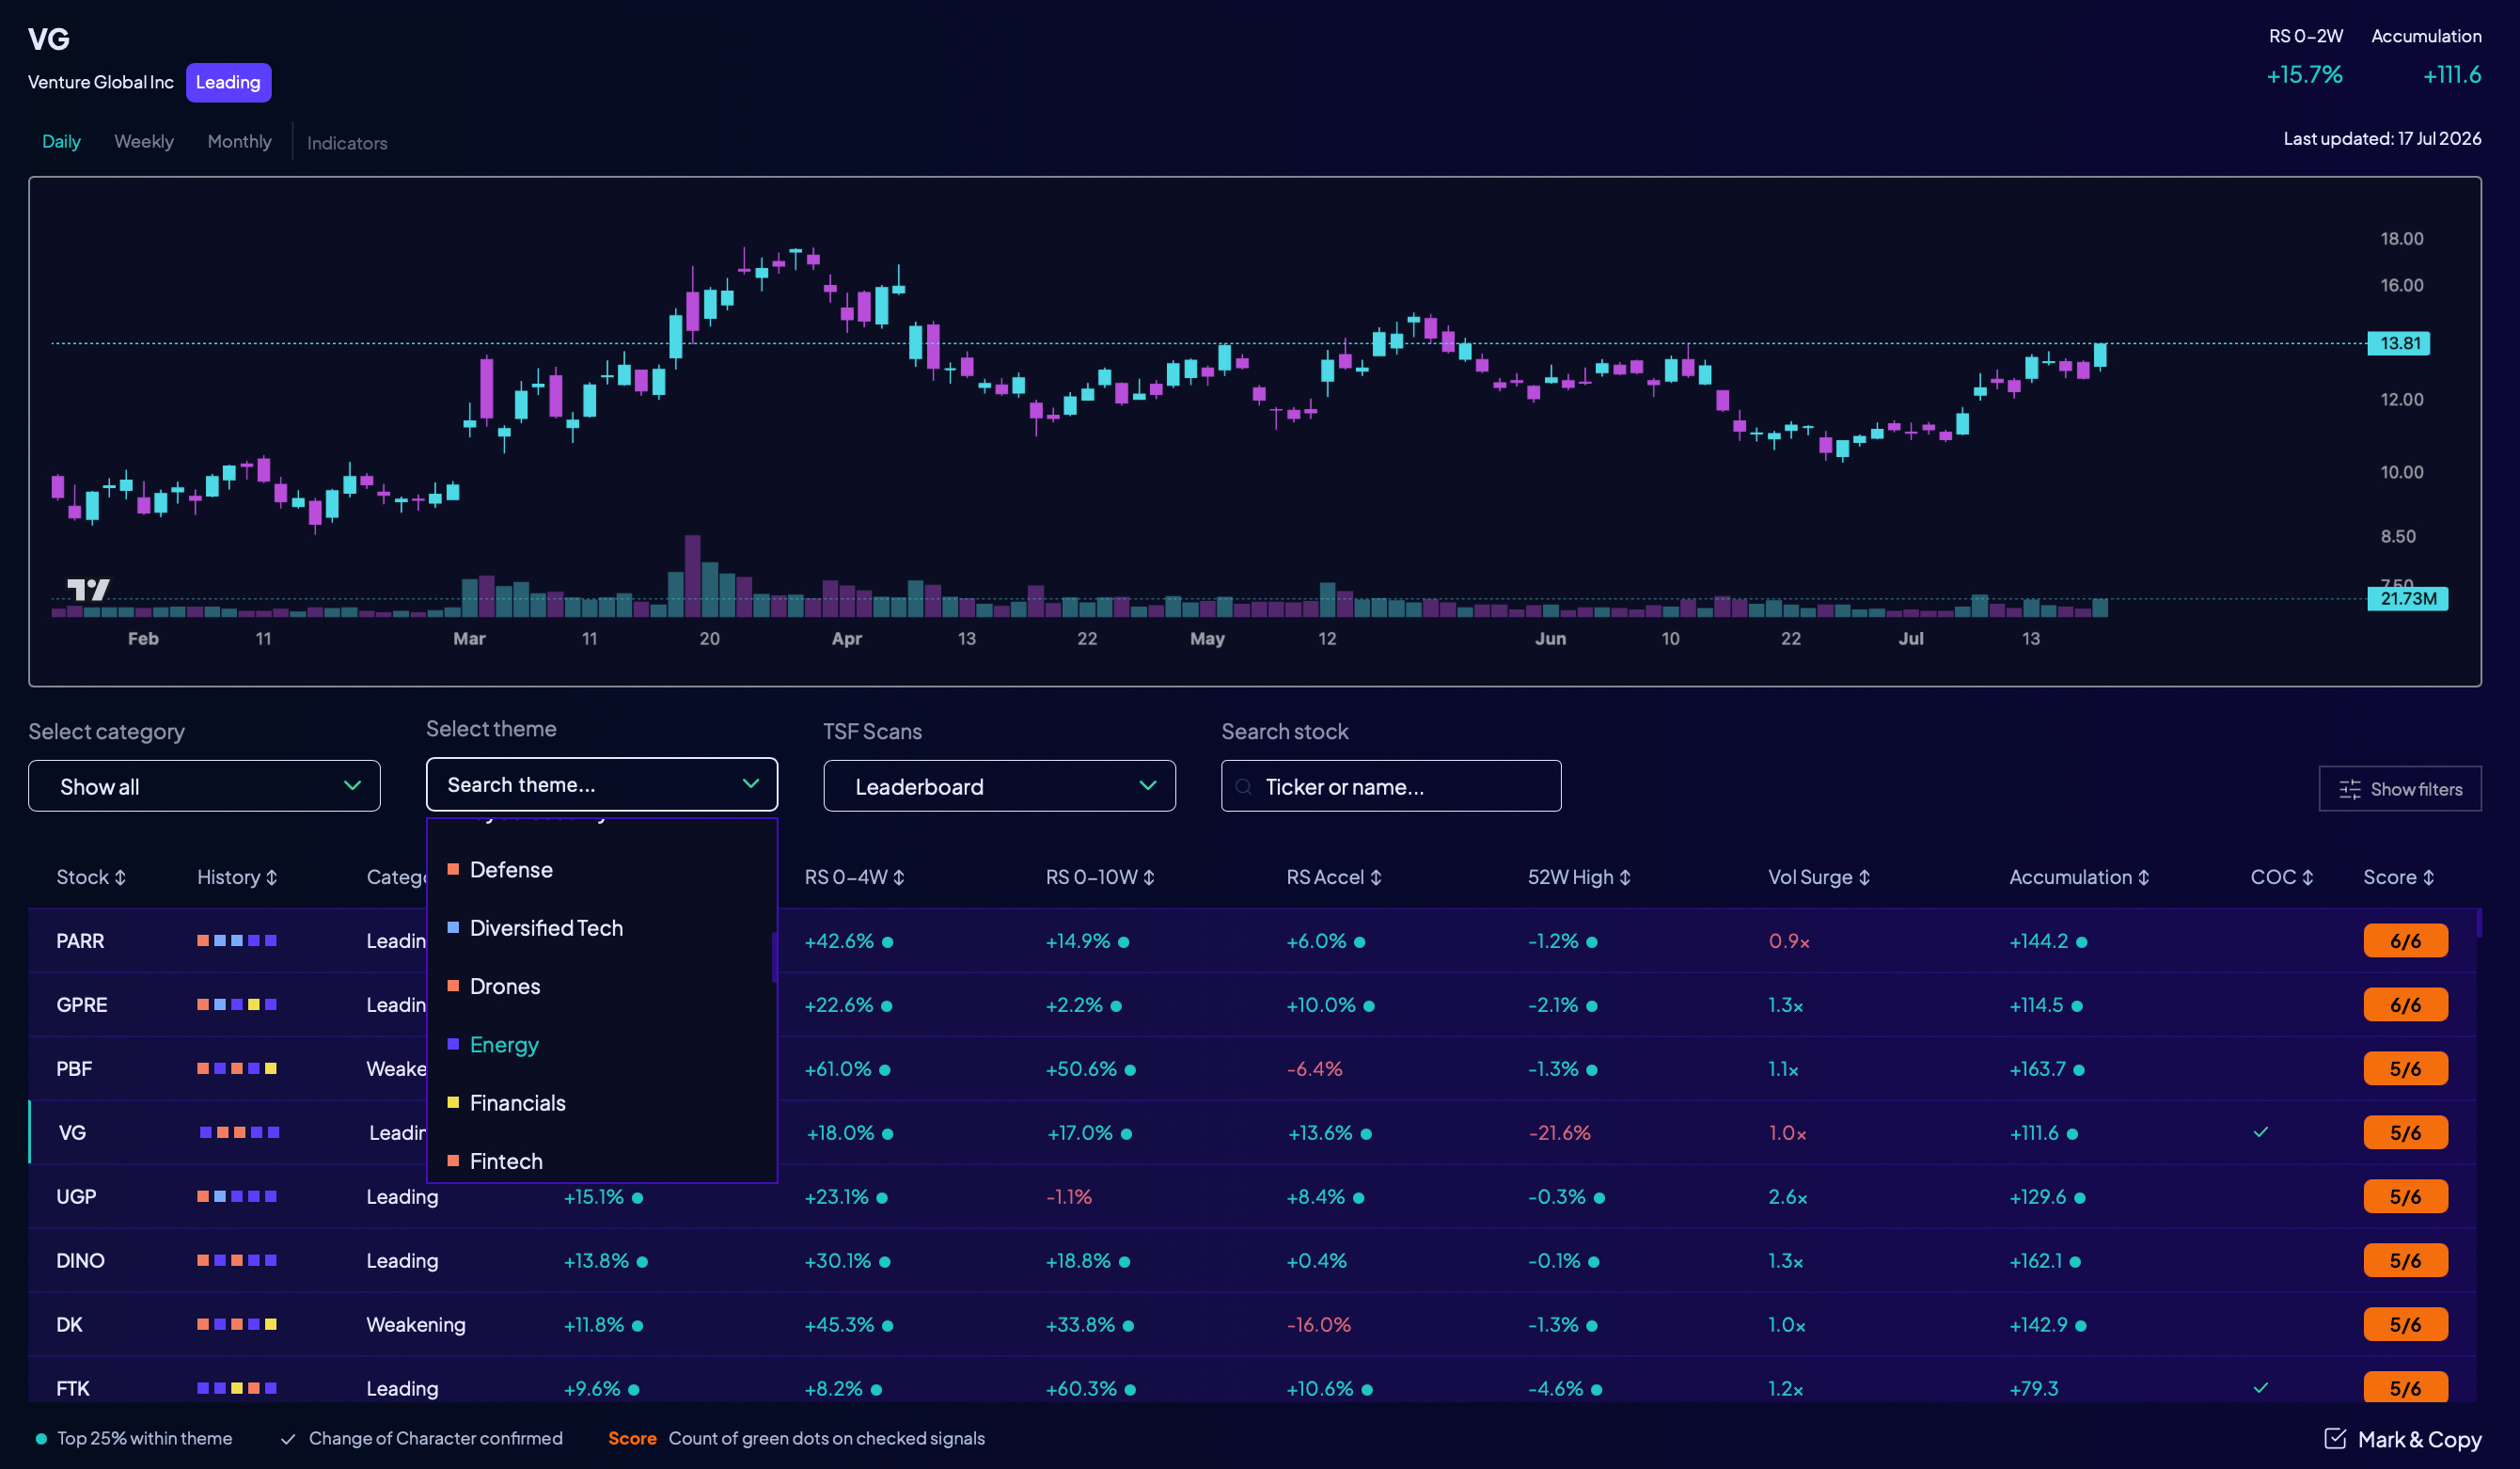
I am working on a huge upgrade to our stock screener. And I want to kindly ask you to share any improvement ideas, creative features you lack elsewhere or other features of interest that can be useful for us.
You can DM, comment or write in our dedicated feature request/TSF - Analytics channel on Discord.
Big things are in the making, I think you will be very happy with what’s coming.
I have designed some features that you won’t find anywhere else that I think will be very useful for us as traders.
But I am always looking for new unique features and ideas to add to the platform, so please share any ideas of interest.
All subscriptions to TSF include access to the TSF - Analytics platform

Today’s Agenda
A close look at the major indices and the levels to watch
Gamma & Skew
CTAs and vol control fund positioning
Growth & High Beta
MAGS New Normal
Quantifying peak rotation trade because that’s when we turn
Dispersion & correlation and the looming followthrough
To re-ignite a strong trend you need poor breadth?
VIX Up-cycle likely starting soon
Sentiment euphoric and a backtest of that euphoria
Credit spreads
Assessing risk on under the hood is a way to understand smart money agenda
Too many stocks bidding can be bad
Nobody understands what the A/D-line tells us
Corporate insiders buying two sectors aggressively
Price action of individual stocks
TSF - Market regime model
High-beta & historical comparisons
Heavy outflows can be bullish
Equity positioning partly stretched
Fund flows are important to track
Some important charts
And in the end I tie everything together and give you my thoughts.
Grab a coffee and enjoy the read.
Lets Start With Zooming Out — S&P 500
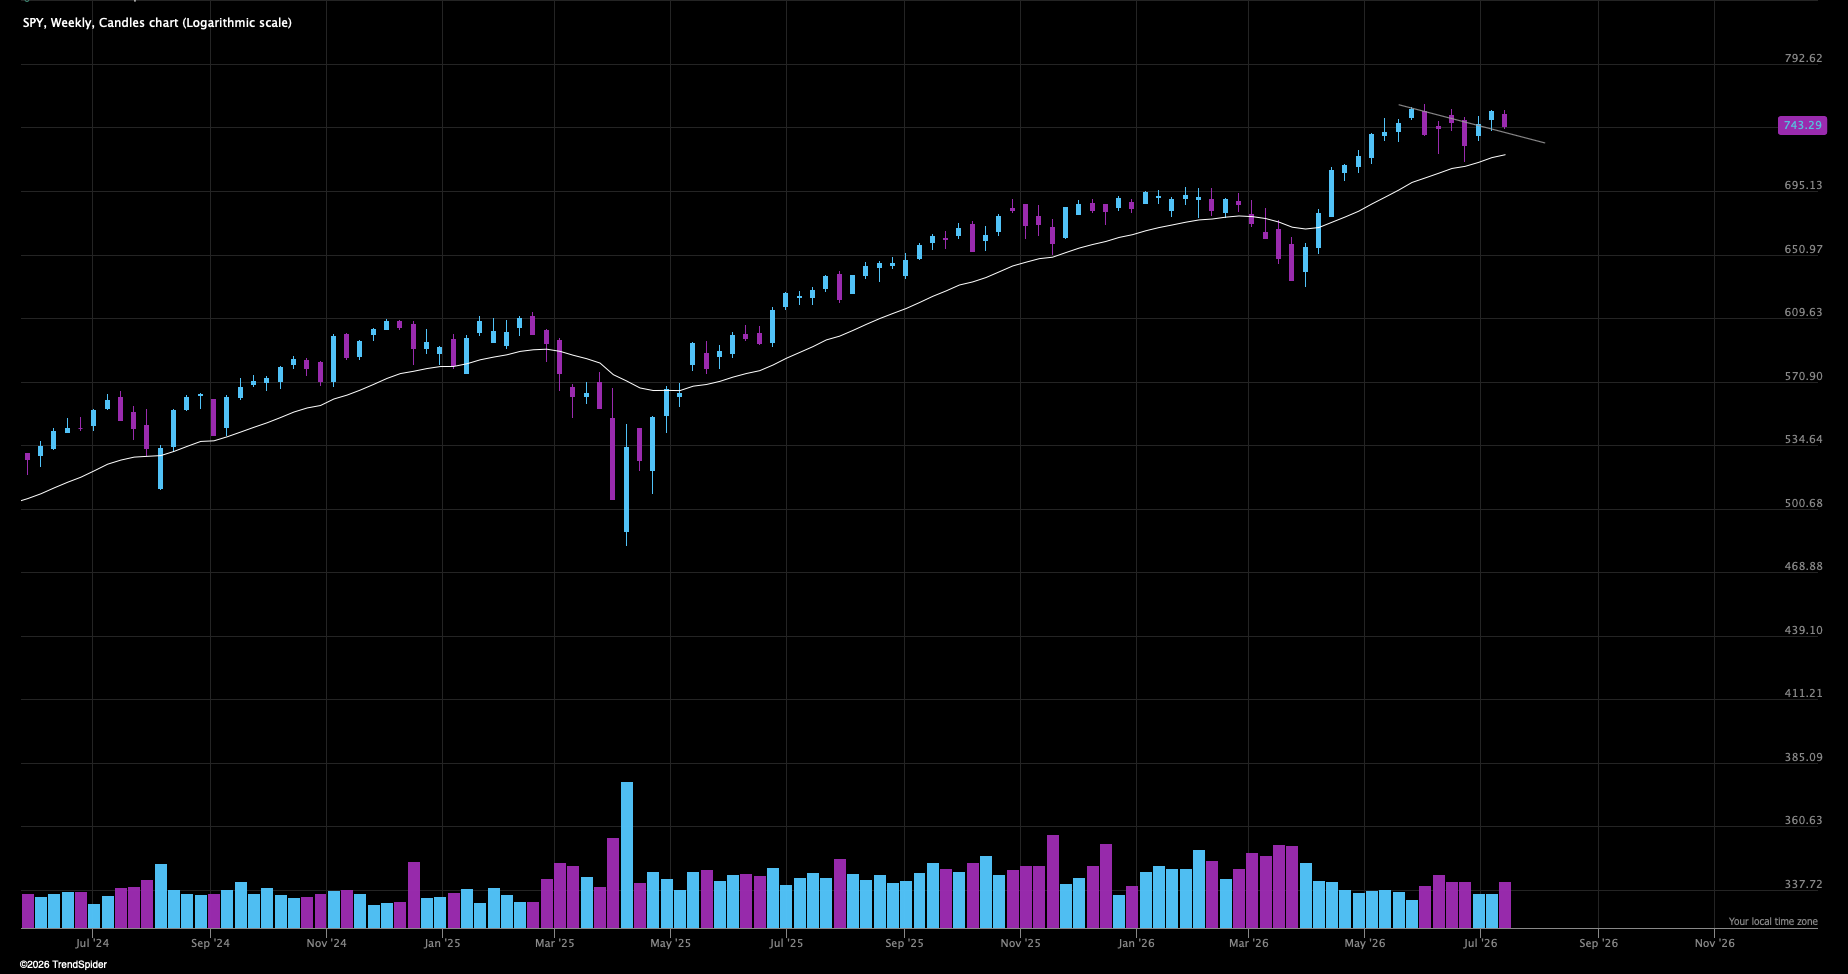
Fakeout from the flag followed by a decline testing the magic line, on higher volume than the breakout.
Bigger picture we are still fine, consolidating near highs.
And like I always say, the real declines start after breaking the weekly EMA 21, it’s getting closer now and will likely be tested soon.
S&P 500 Daily — Change Of Character
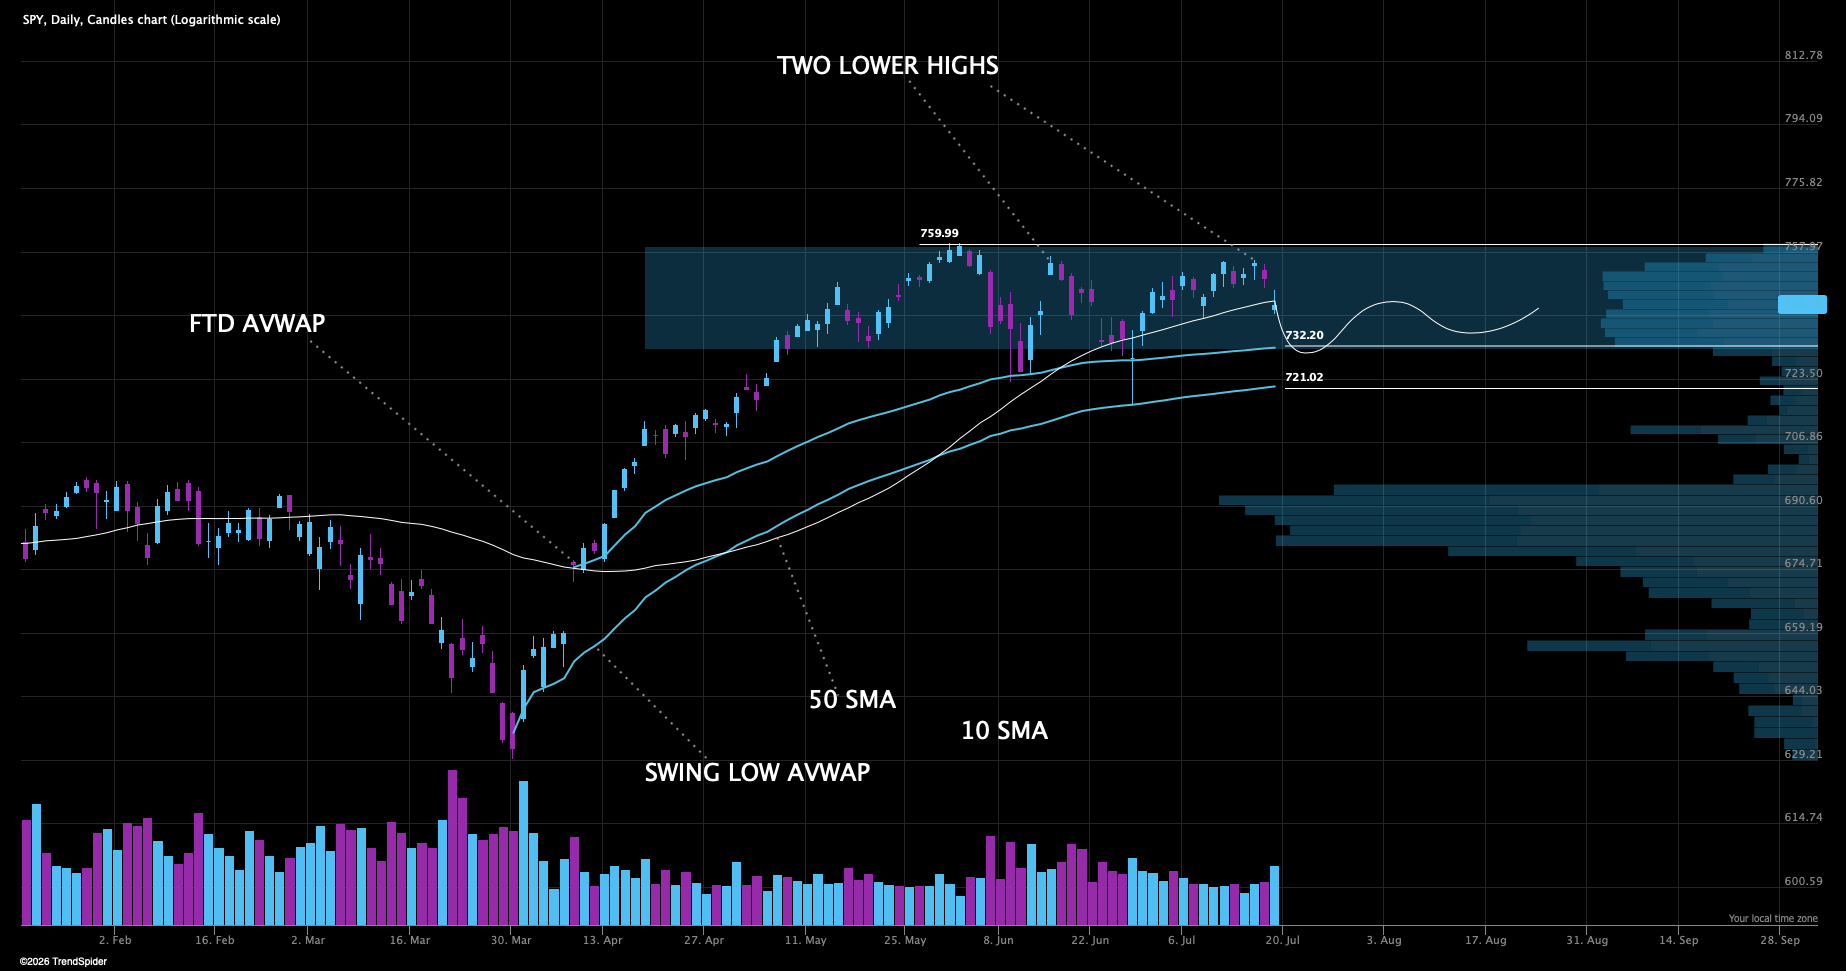
After Friday we have a clear character change to pay attention to, the first clean close under the 50 SMA since this uptrend started. That is objective evidence of trend fatigue and weakening bid
We have now staged two lower highs and remain in a range bound market
Intermediate uptrend is under pressure as we lost the 50 SMA.
Friday’s close looks weak and I think that opens up for a new gap down or weakness early next week.
Unless news changes things, I am expecting a test of the FTD AVWAP this week and we would like to see buyers defending the swing low AVWAP at least.
The bulls job this week is to reclaim the 50 SMA, even in bull markets we can stay below the 50 SMA for a couple of days and sometimes more. But the longer we stay under it, the more complicated the path forward often becomes.
We Are In A Negative Gamma Environment
Simply put, in a negative gamma environment, market makers sell into selling and buy into buying — amplifying the moves both ways.
In positive gamma environments, what we experience as the easy grind up, market makers buy dips and sell rips which makes the market more stable — which is what a favorable environment for swingtrading looks like.
(Source: www.menthorq.com)
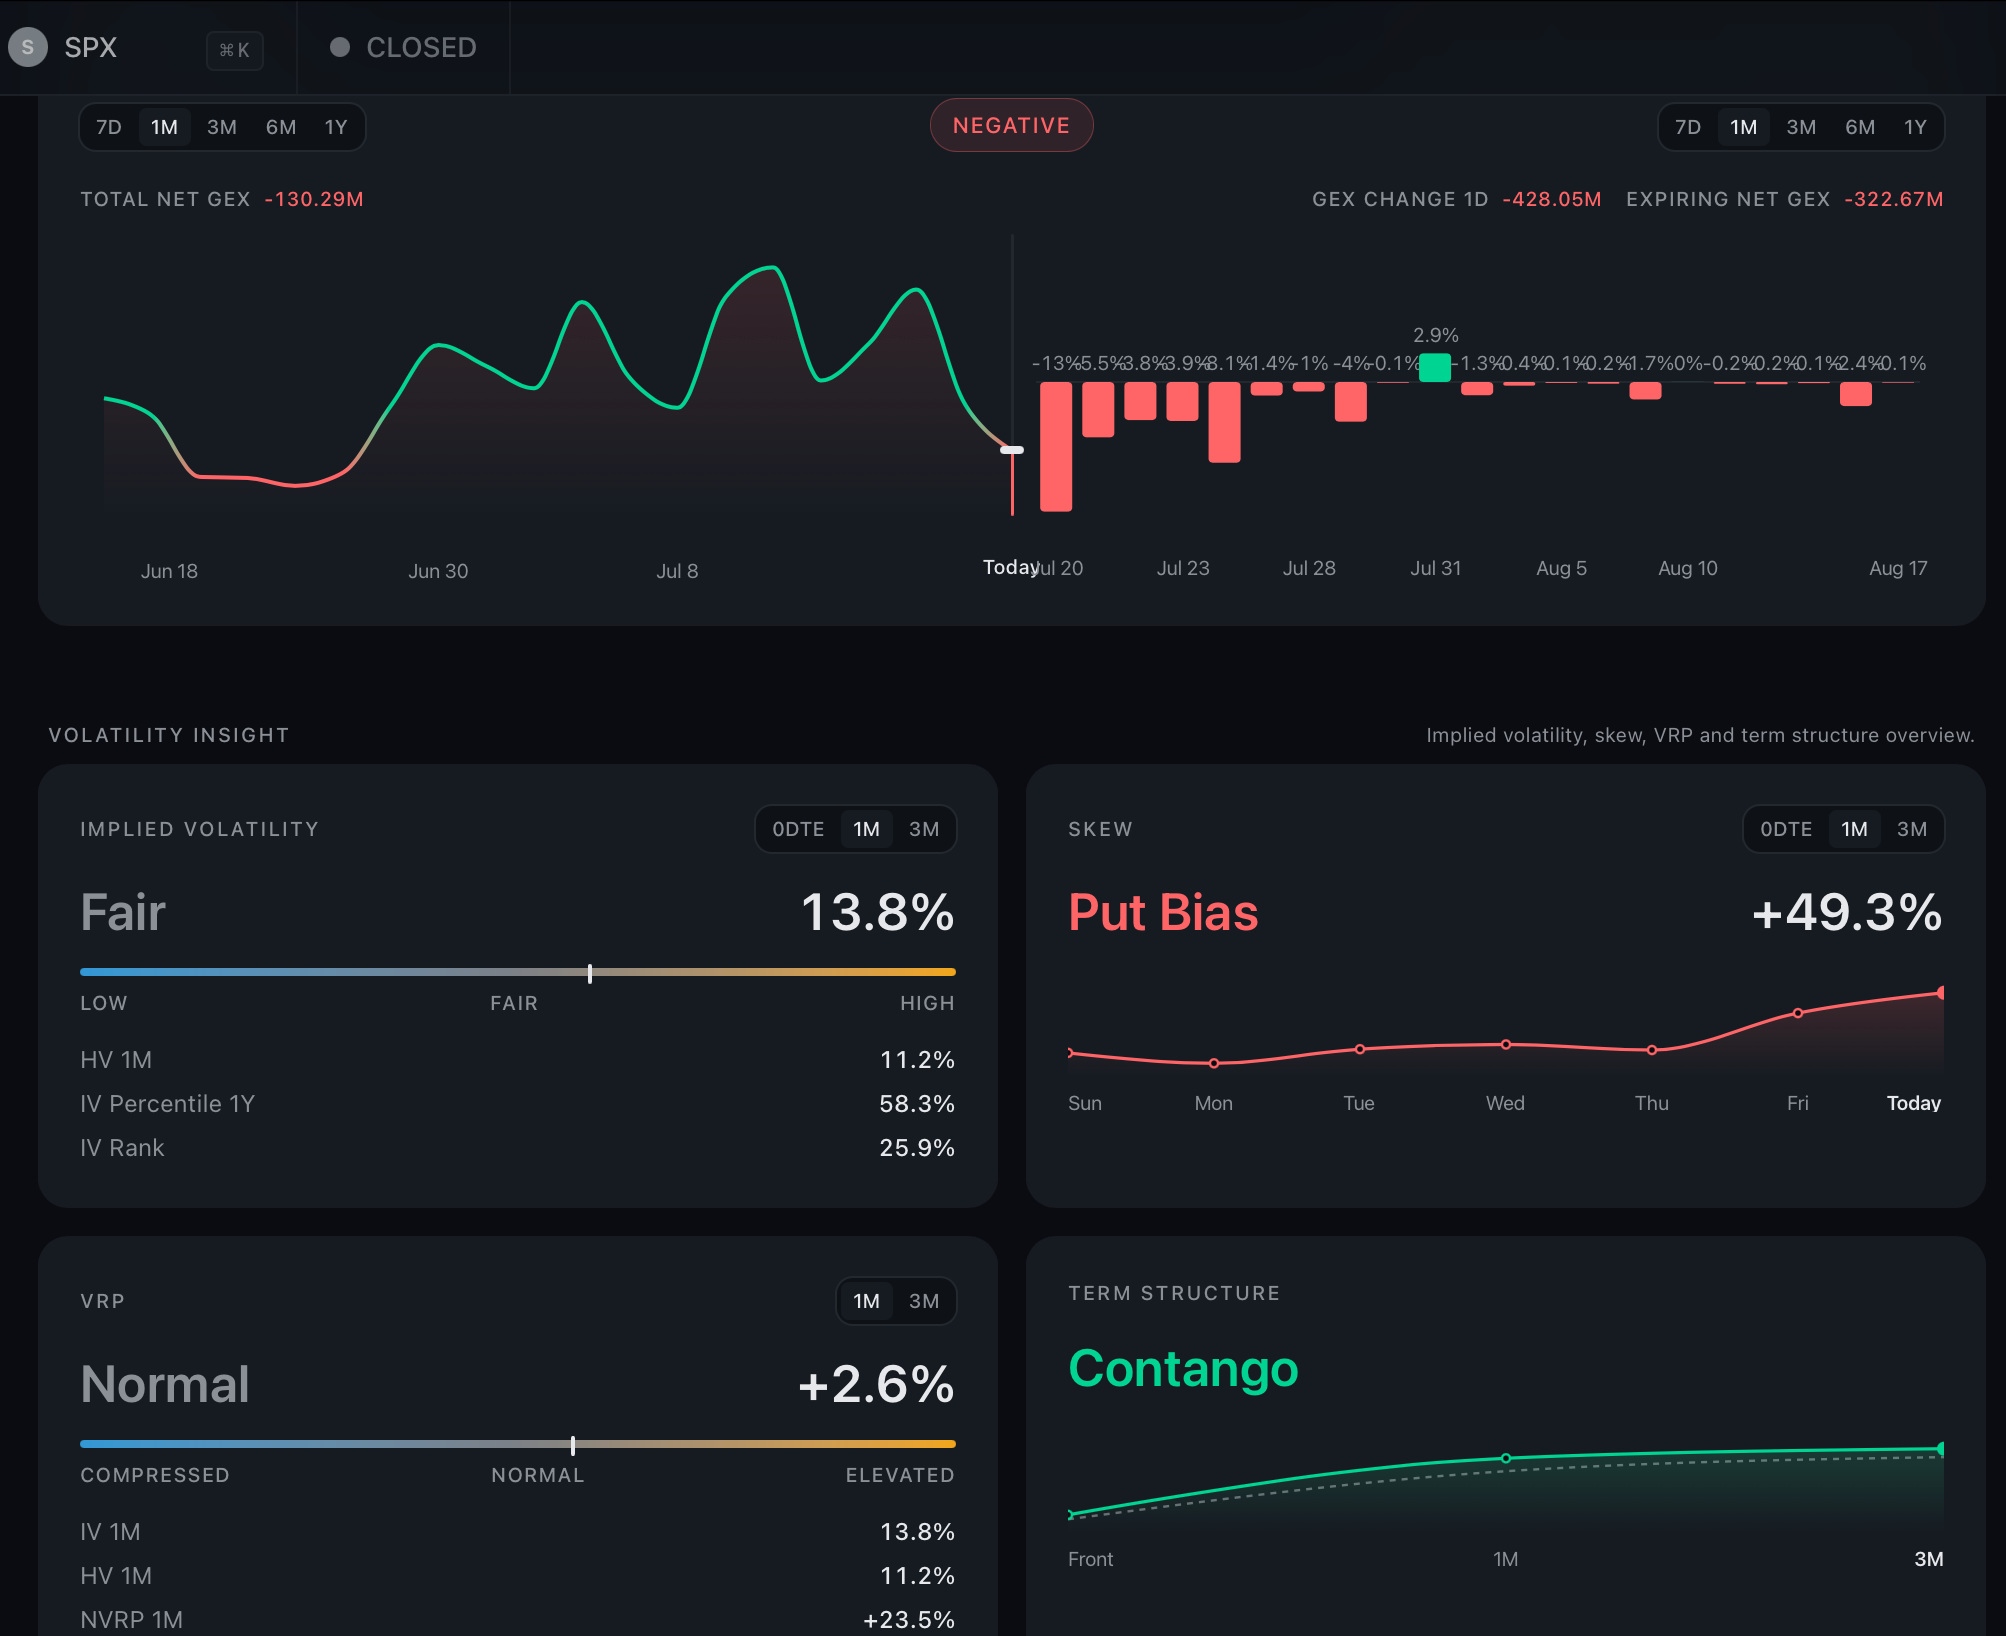
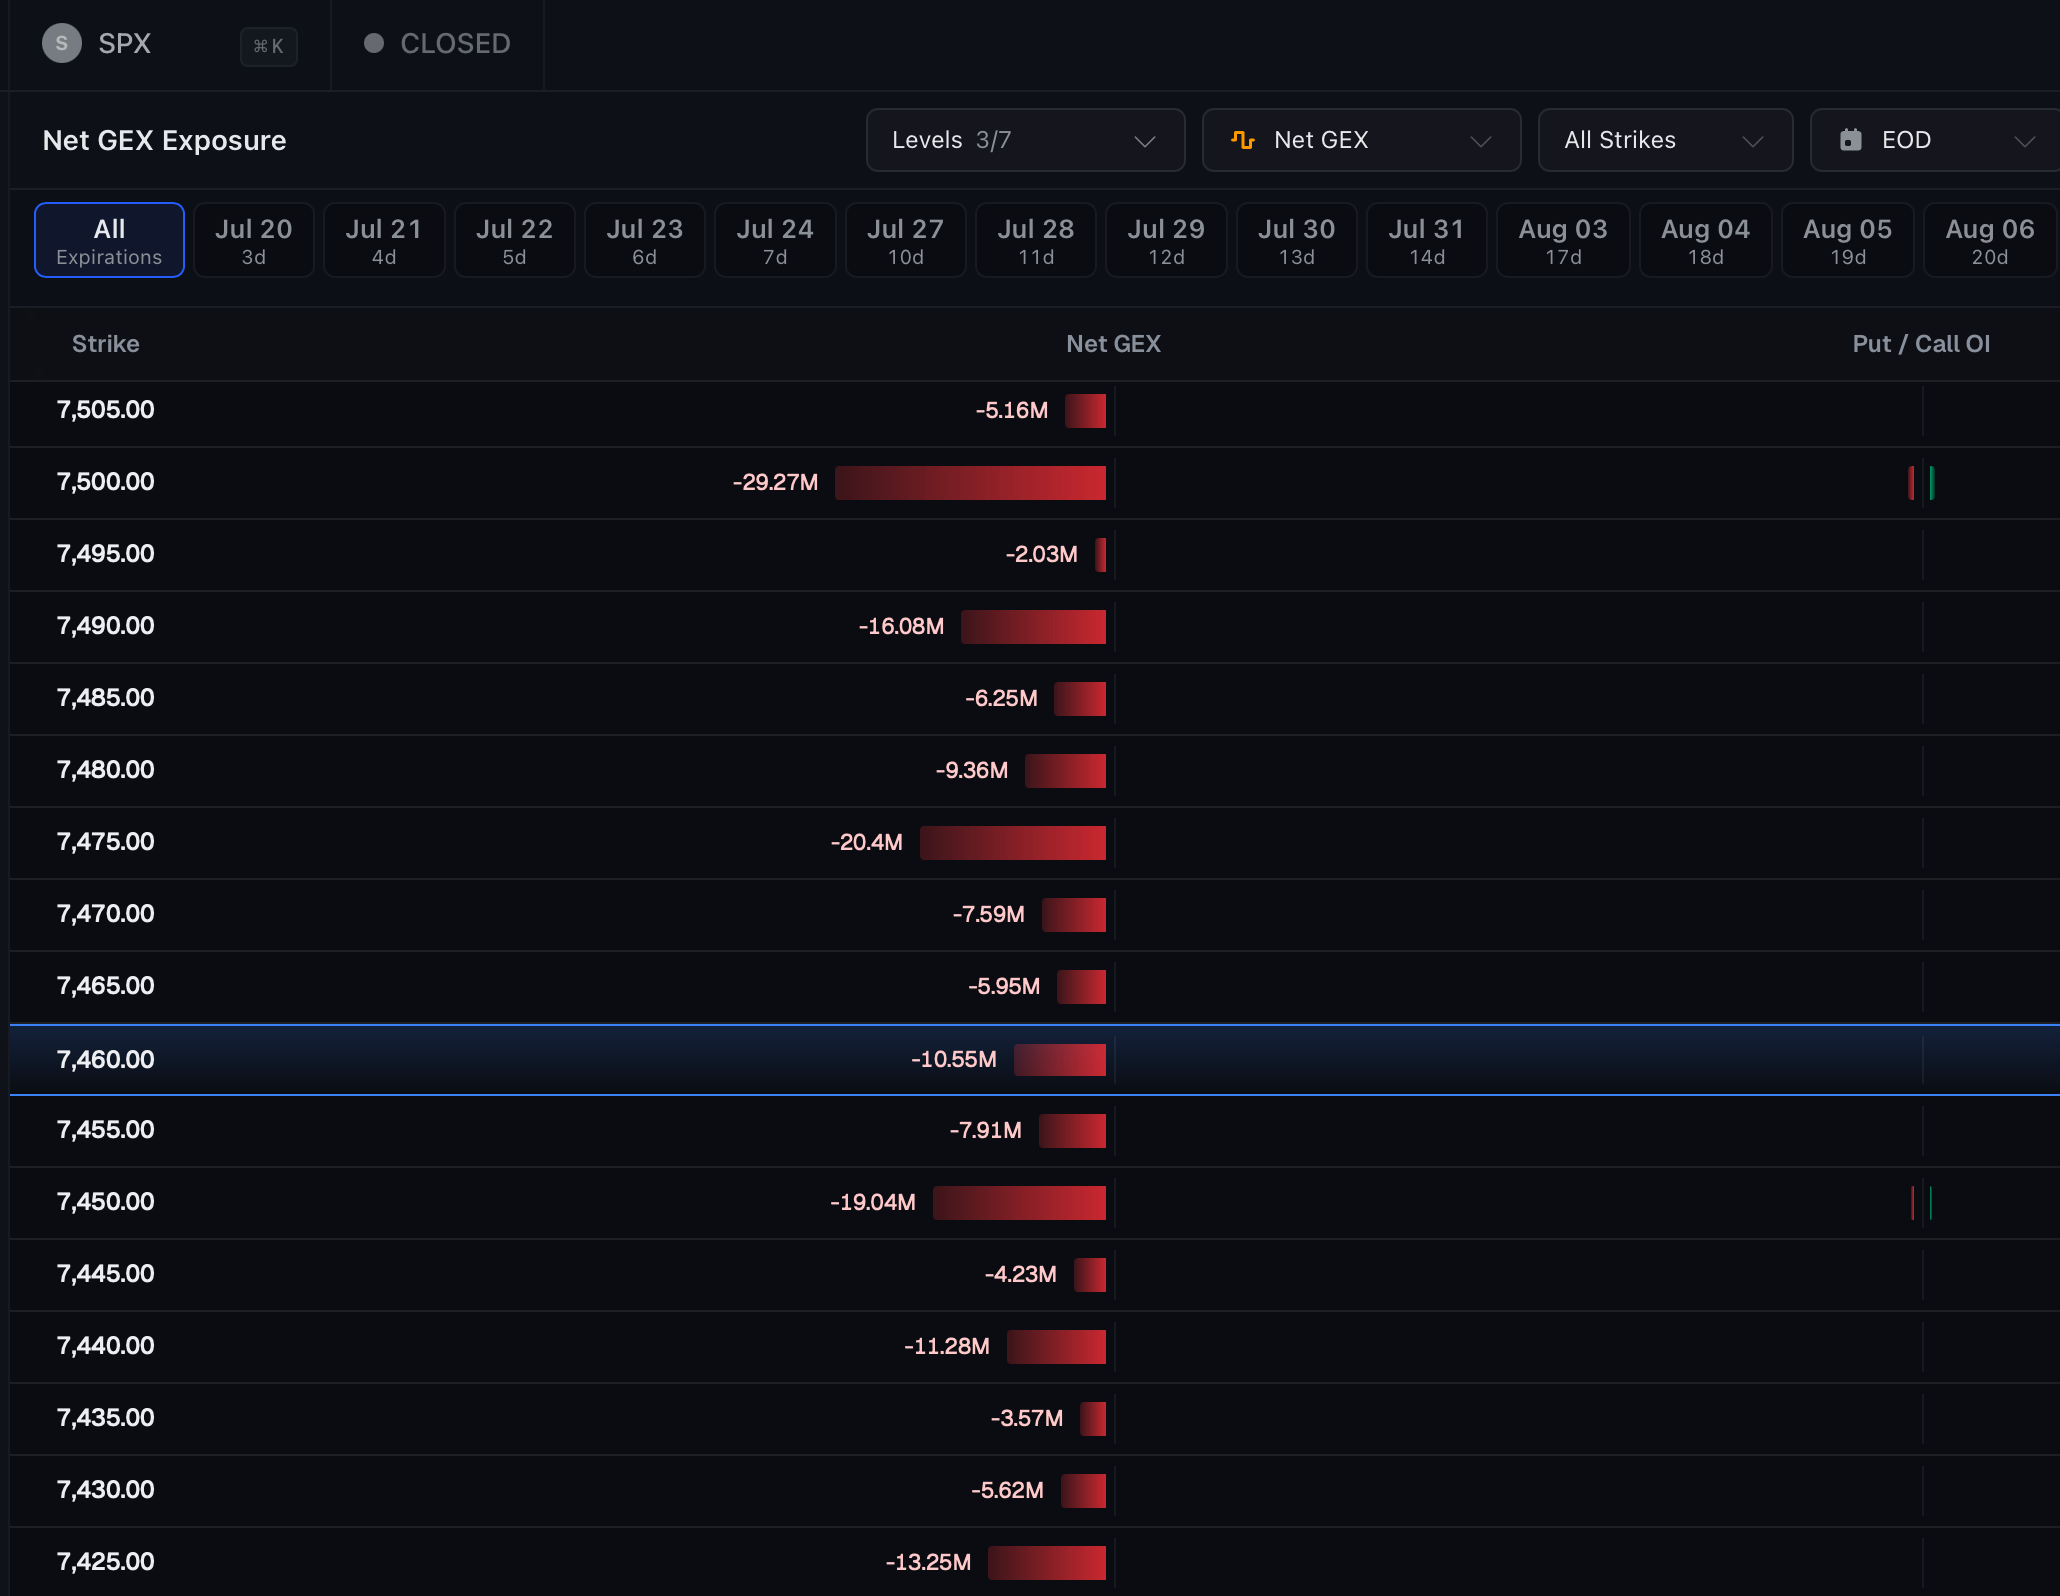
Gamma flip level for SPX is higher up at 7540, and we see that after OPEX the put support has moved down 7300 which is therefore a level of interest to watch on the downside.
Generally when put support is moved further down it can be viewed as slightly bearish, when also combined with the fact that we now have put bias across ODTE, 1 month and 3 month skew.
Some real hedging is taking place under the hood.
Trend Following CTAs — Projections
Trendfollowing CTAs are systematic strategies that align with the trend. They have trigger levels where they sell, they don’t care about fundamentals. If price is supportive they add exposure, if trend is broken or weakening they sell.
And they matter because they are huge market participants and therefore can move the market.
(Source: www.menthorq.com)
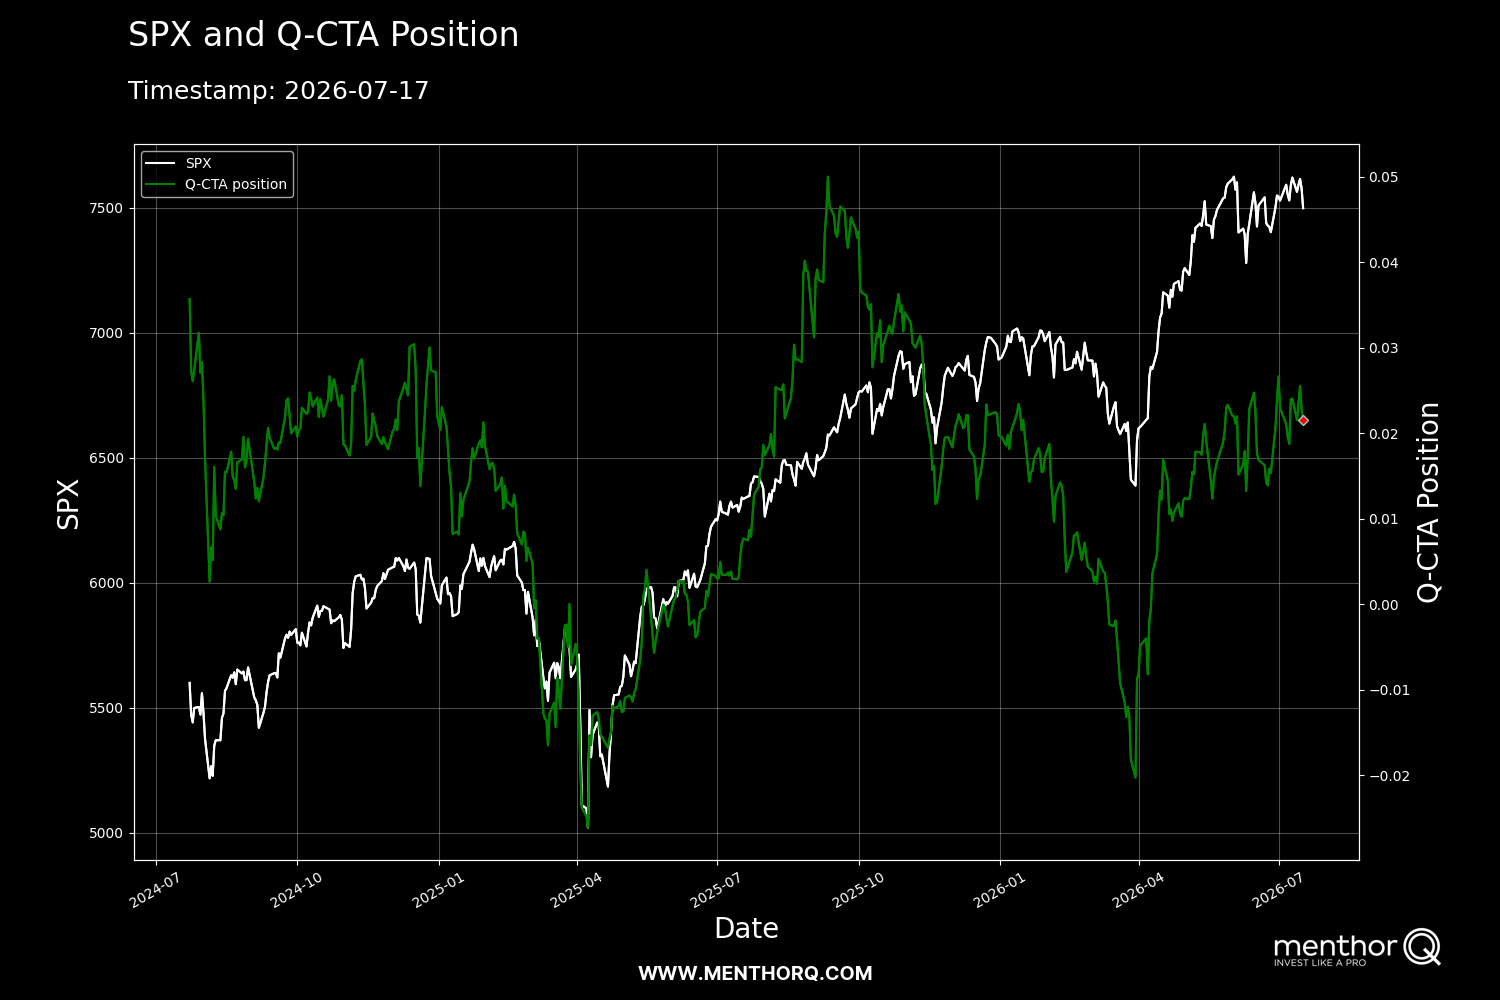
Still no big change in their positioning, they have however sold the Nasdaq a bit more. But so far no significant selling pressure added from CTAs.
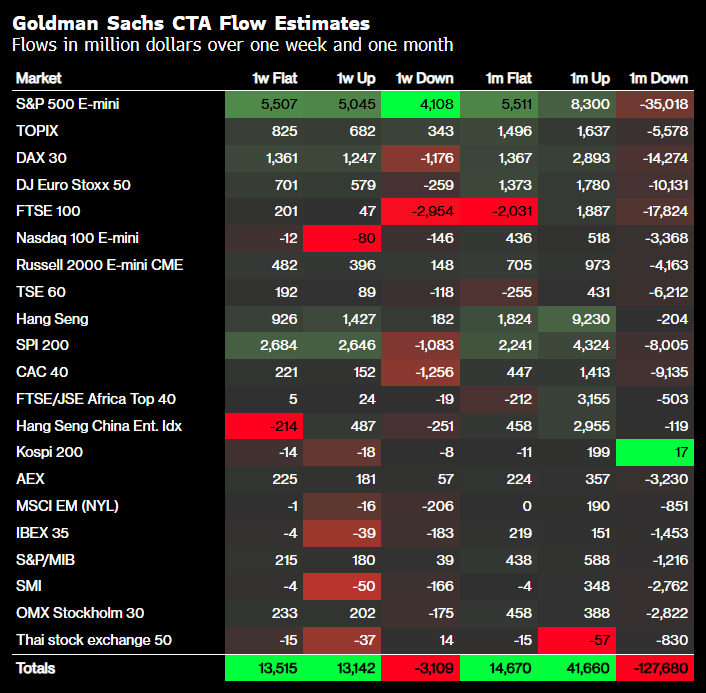
And looking at projections, flows are largely supportive one week out regardless of market direction.
We need a stronger down move to trigger more heavy selling.
Vol - Control Funds
Vol-control funds are huge market participants, they provide inflows and liquidity when the realized vol is under their threshold, and can be systematic sellers when realized vol climb.
(Source: www.menthorq.com)
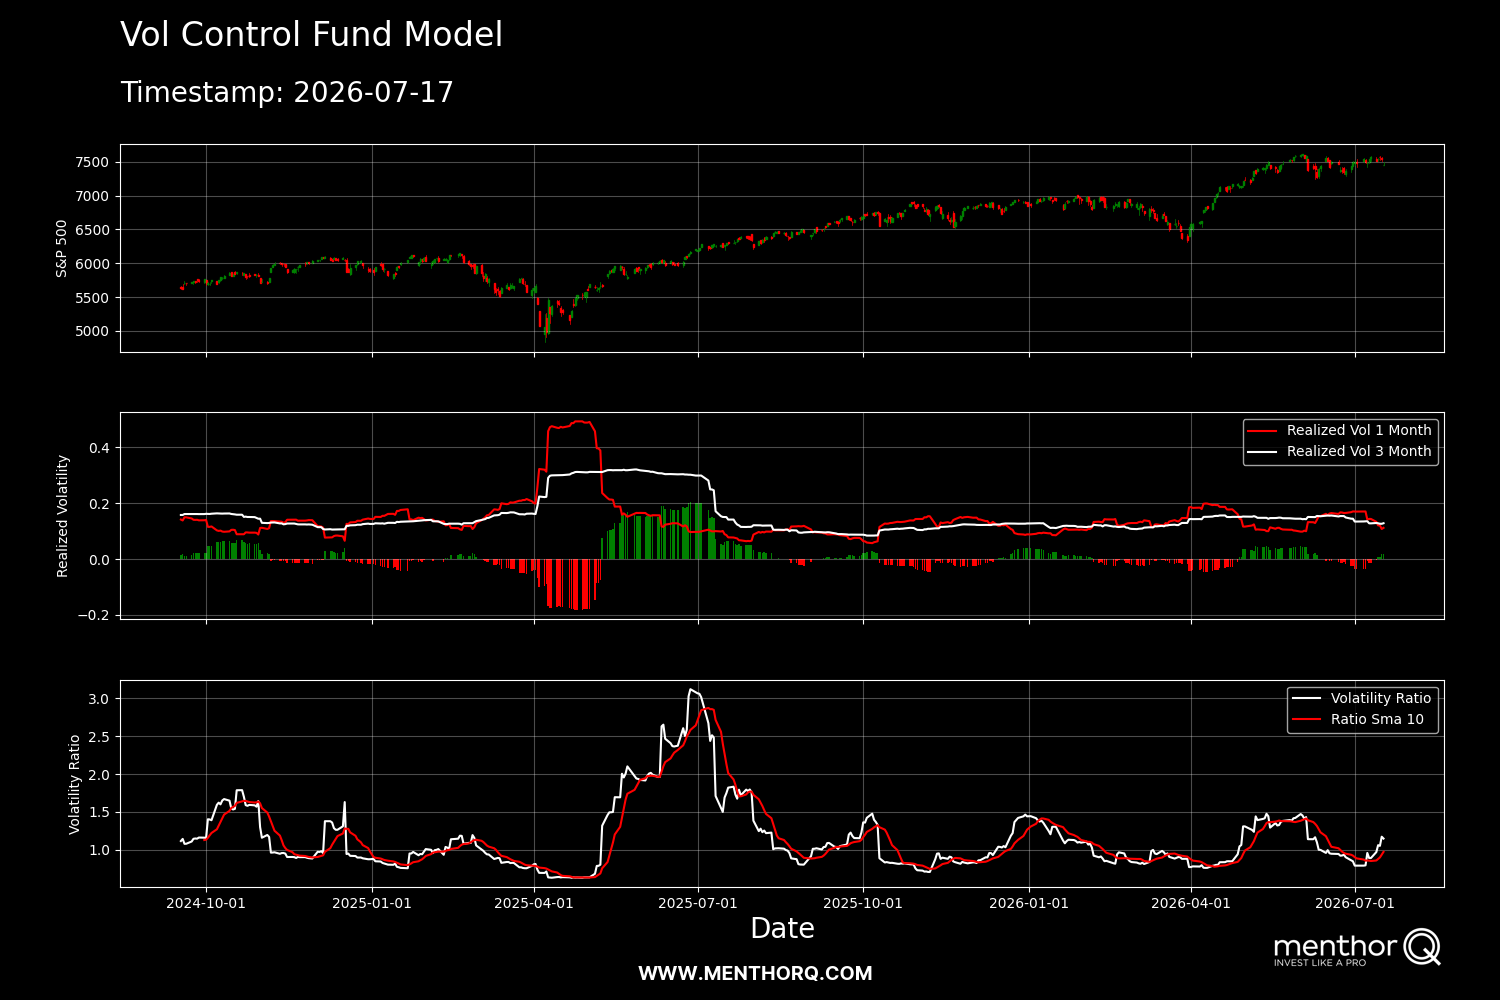
1 month realized vol is declining fast which means inflows from vol control funds which is supportive for the market.
What also most often happens when realized vol contracts rapidly, is that a vol event can trigger mechanical selling when vol control funds are max long, which they should be in about a week.
Short term supportive, a little longer term a risk for a shakeout.
QQQ Weak
Closed below put support and the 700 level
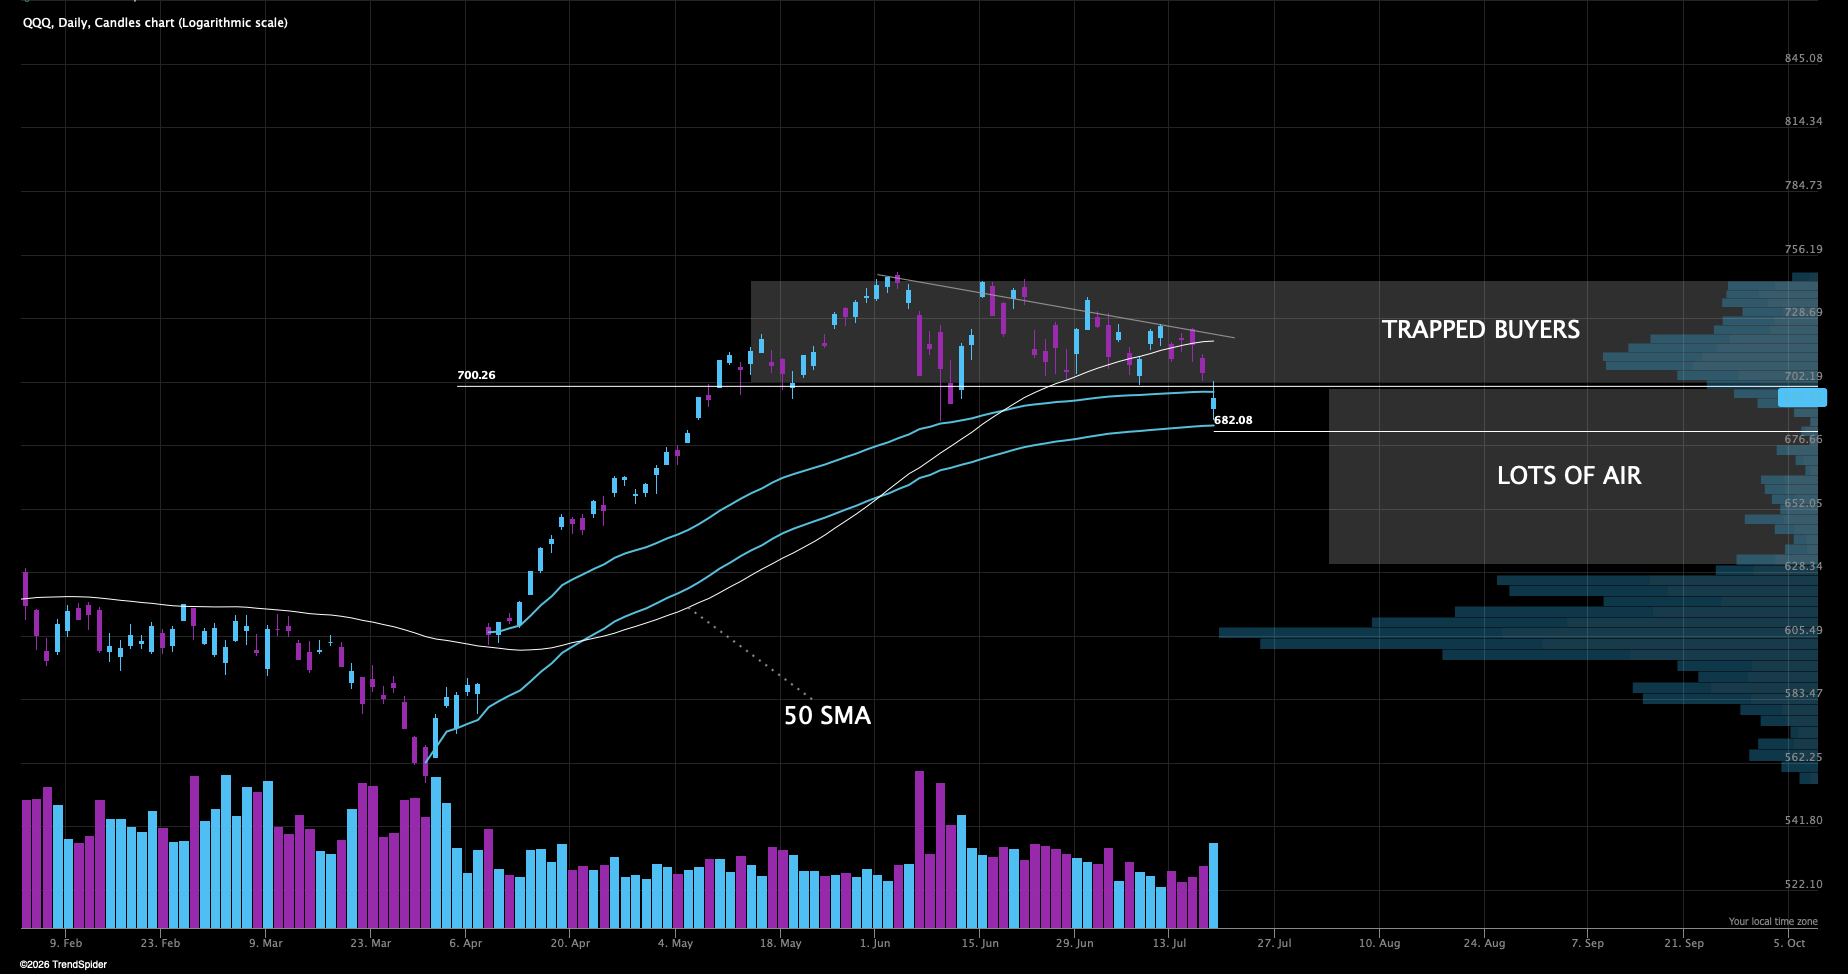
And QQQ is wedged between these AVWAPs, weakness from can cause escalation to the downside quick. What assets more often do is test the 50 SMA from underneath before following through to the downside.
Lets see, but key spot here that needs to be defended. My lean is a quick snap back soon for the Qs squeezing into the 50 SMA.
Extreme Volume In MAGS
Consecutive HVEs in the MAGS ETF.
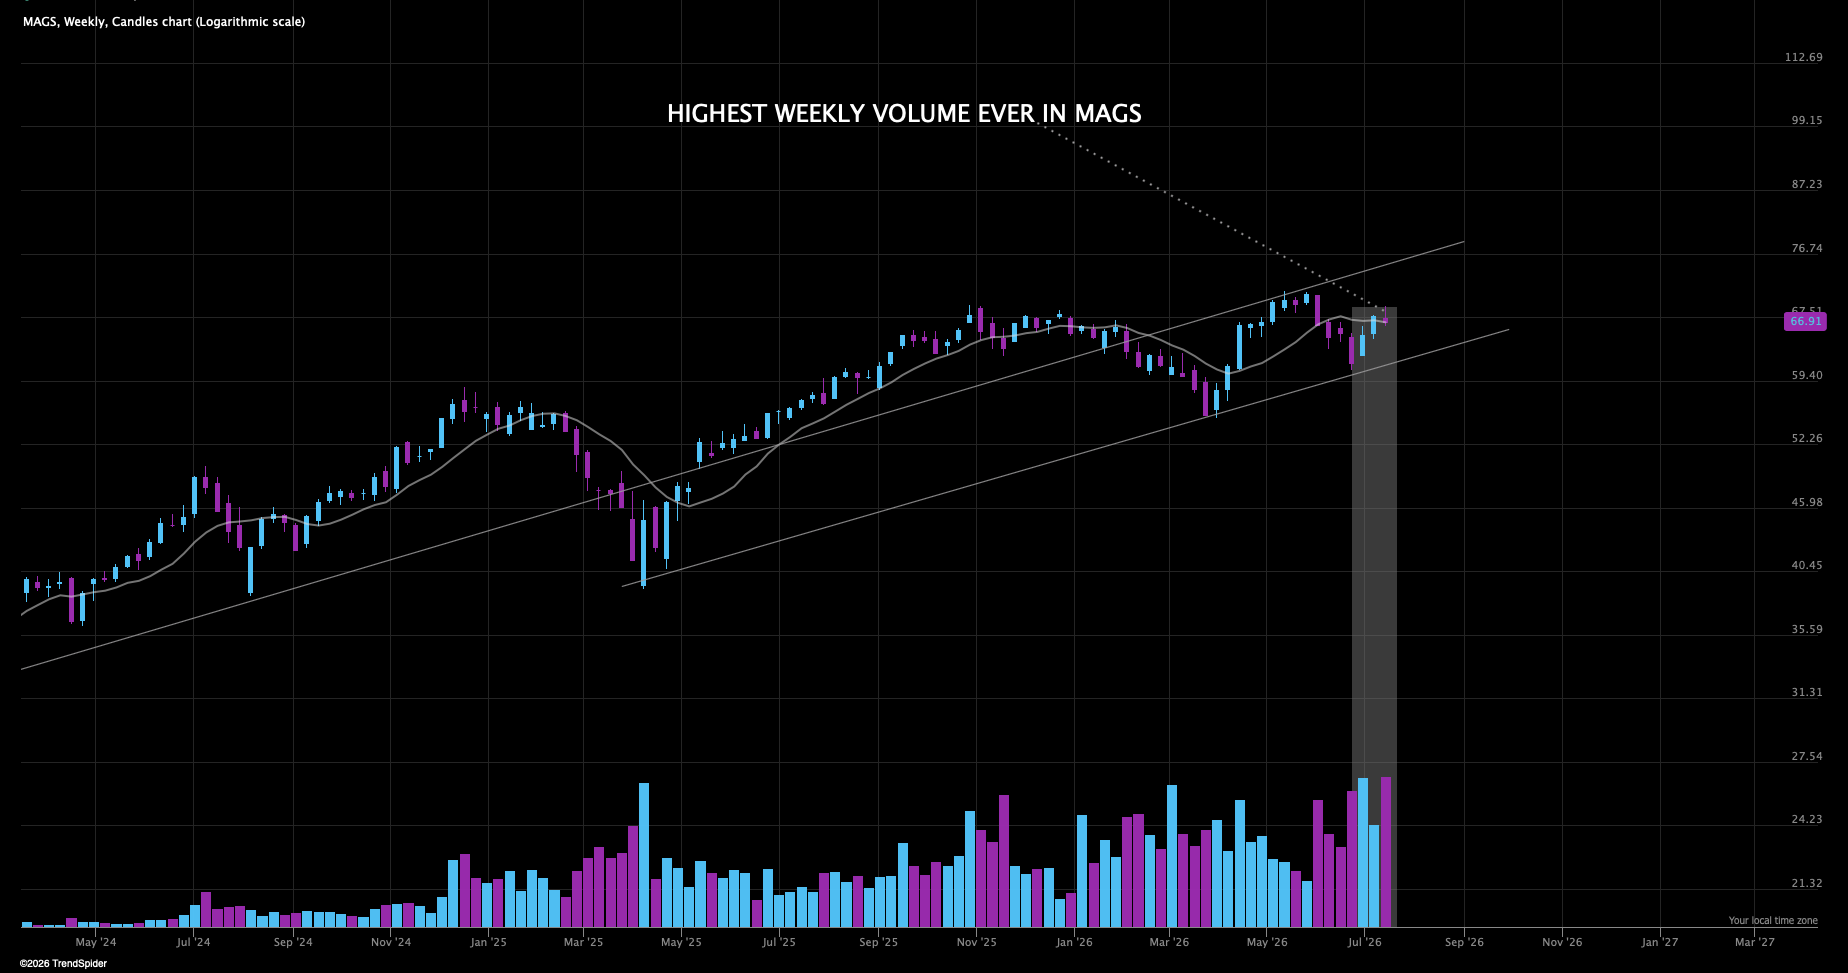
This week extreme volume on rejection into the 10 weekly SMA. Looks like a pause here is likely.
Small Caps Should Test 50 SMA
Small caps have been resilient, but are weakening.
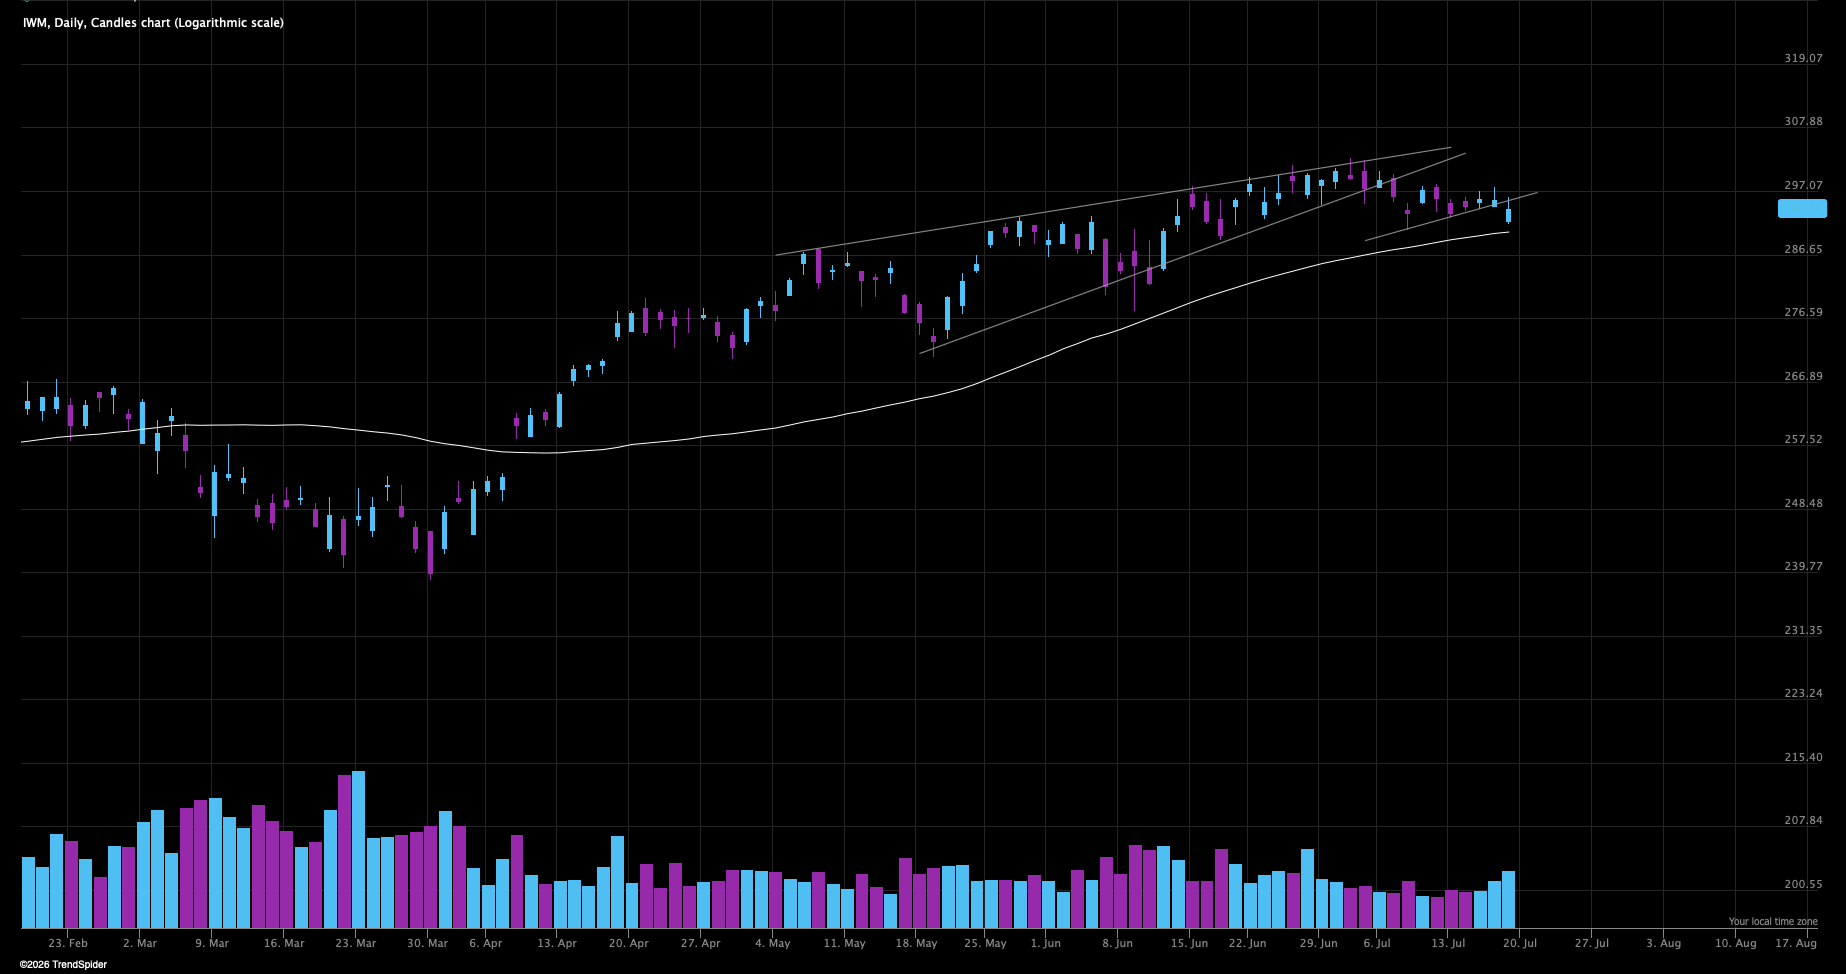
50 SMA is too close to not be tested at this point, expecting that into this week and ideally that test holds.
If we see escalating weakness in small caps that is a cautionary sign of risk appetite worsening further.
Growth & High Beta Underperforming
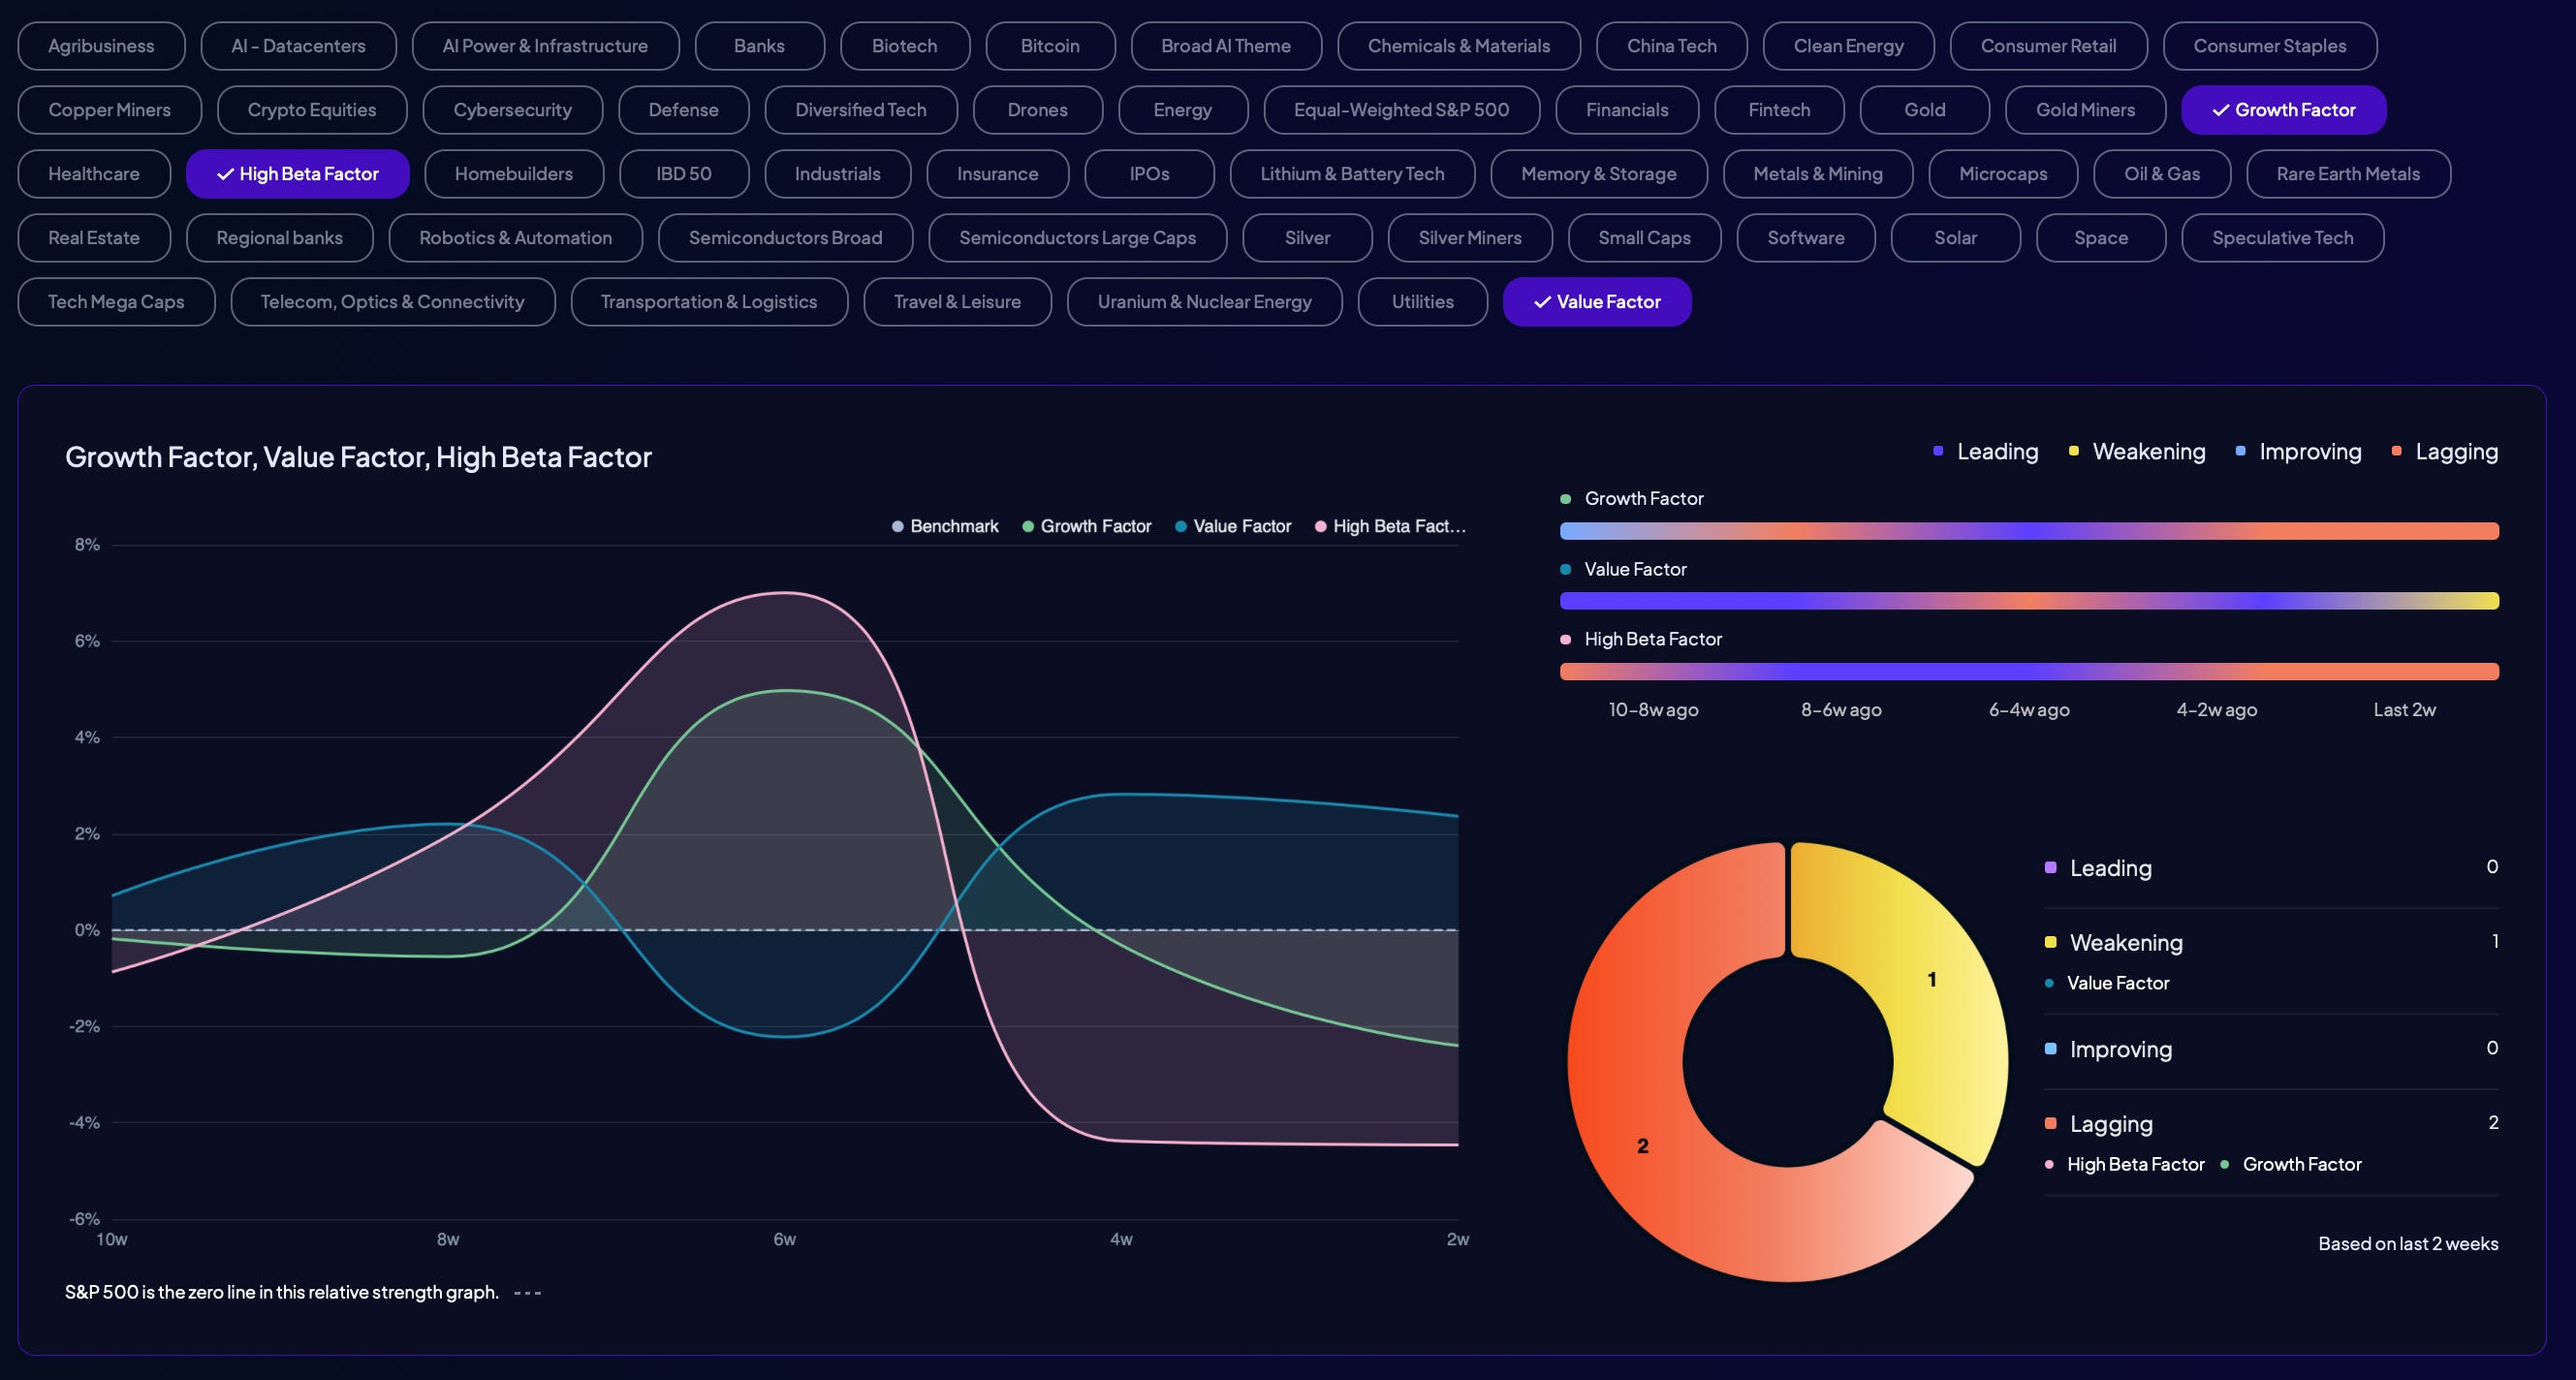
We continue to see rotation into value and out of growth and high beta. Value is outperforming but stalling currently, lets see if it’s time for some rotation back into growth.
But overall picture is a clear rotation away from growth ex mega caps.
At The Same Time Equal - Weighted S&P 500 Looks Heavy
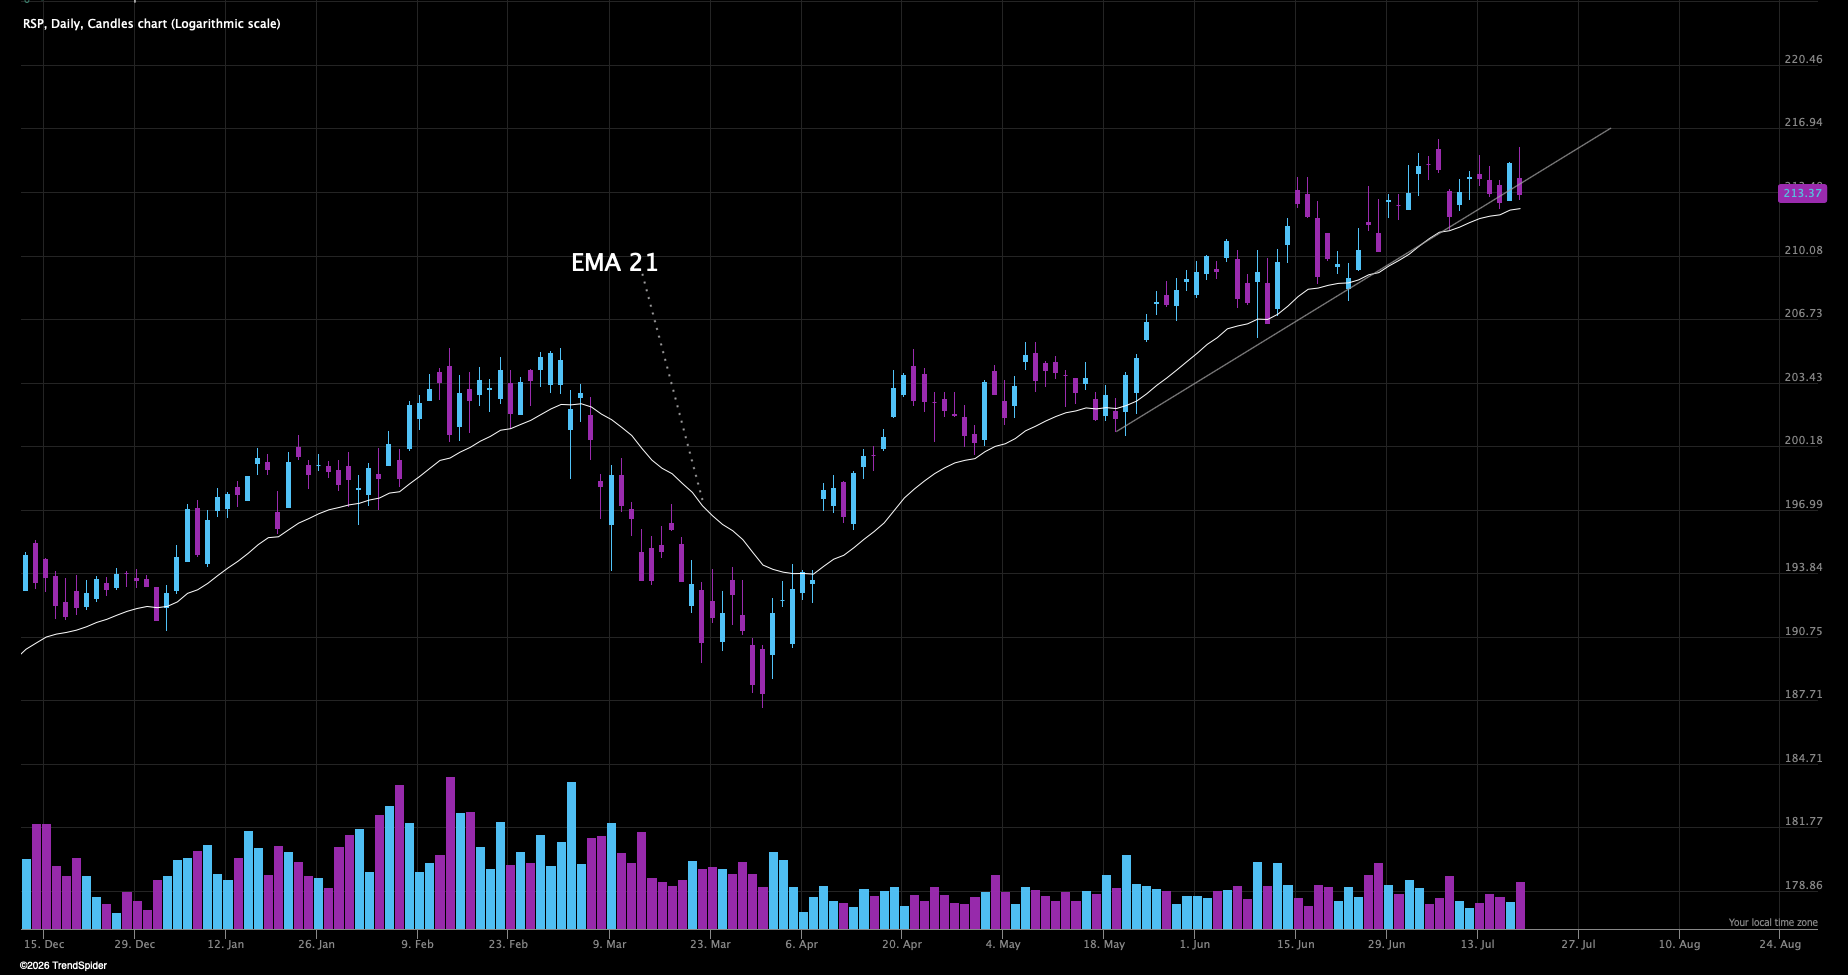
And we are also starting to see some cracks in the rotation trade although I still think it can continue some more.
And it is important to understand that when we hit peak rotation, that is often where the market turns and resumes it’s uptrend.
And lately we have been able to quantify that in some way by looking at the RSP/QQQ ratio chart
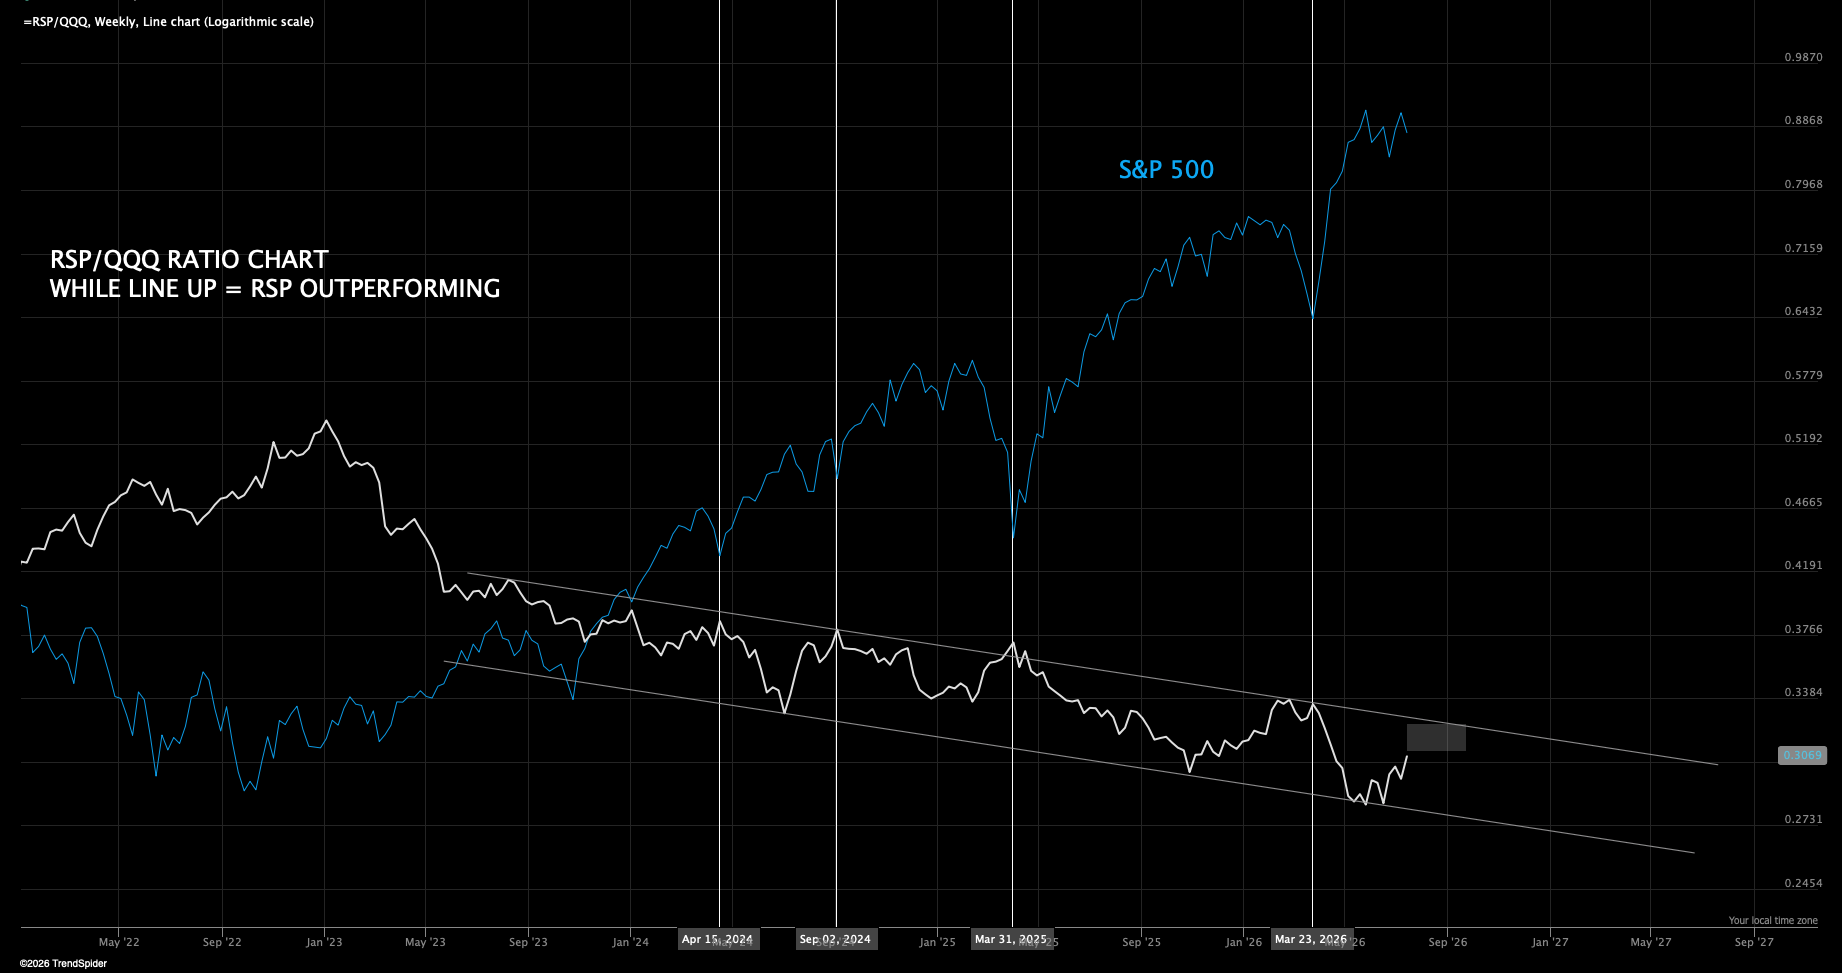
When the market has rotated sufficiently away from QQQ and into RSP, the market often finds it’s low.
We are not there, but watching this closely. And the key dynamic I highlight every week is still in play. When weakness starts the leaders will dive, semis, AI - trade and tech. And money will rotate into other sectors and defensives.
If weakness continues and rotation into tech doesn’t occur, everything will fall together. Because when we have rotated enough and still see no bid into tech, the market will decline together because the money can’t hide anywhere and is therefore withdrawn from equities as an asset, causing a broader decline.
Not there yet, but a key dynamic to keep monitoring. We need the old leaders to awaken soon.
Correlation Curling Up But Dispersion At A High
I have explained this dynamic before, we are currently in a state of two extremes.
Correlation being very low, meaning stocks don’t move together they move on their own merit.
And dispersion high, which means there is a large performance gap between stocks.
And when the ratio of these two spikes and tops, those are often some dangerous times for the market short term.
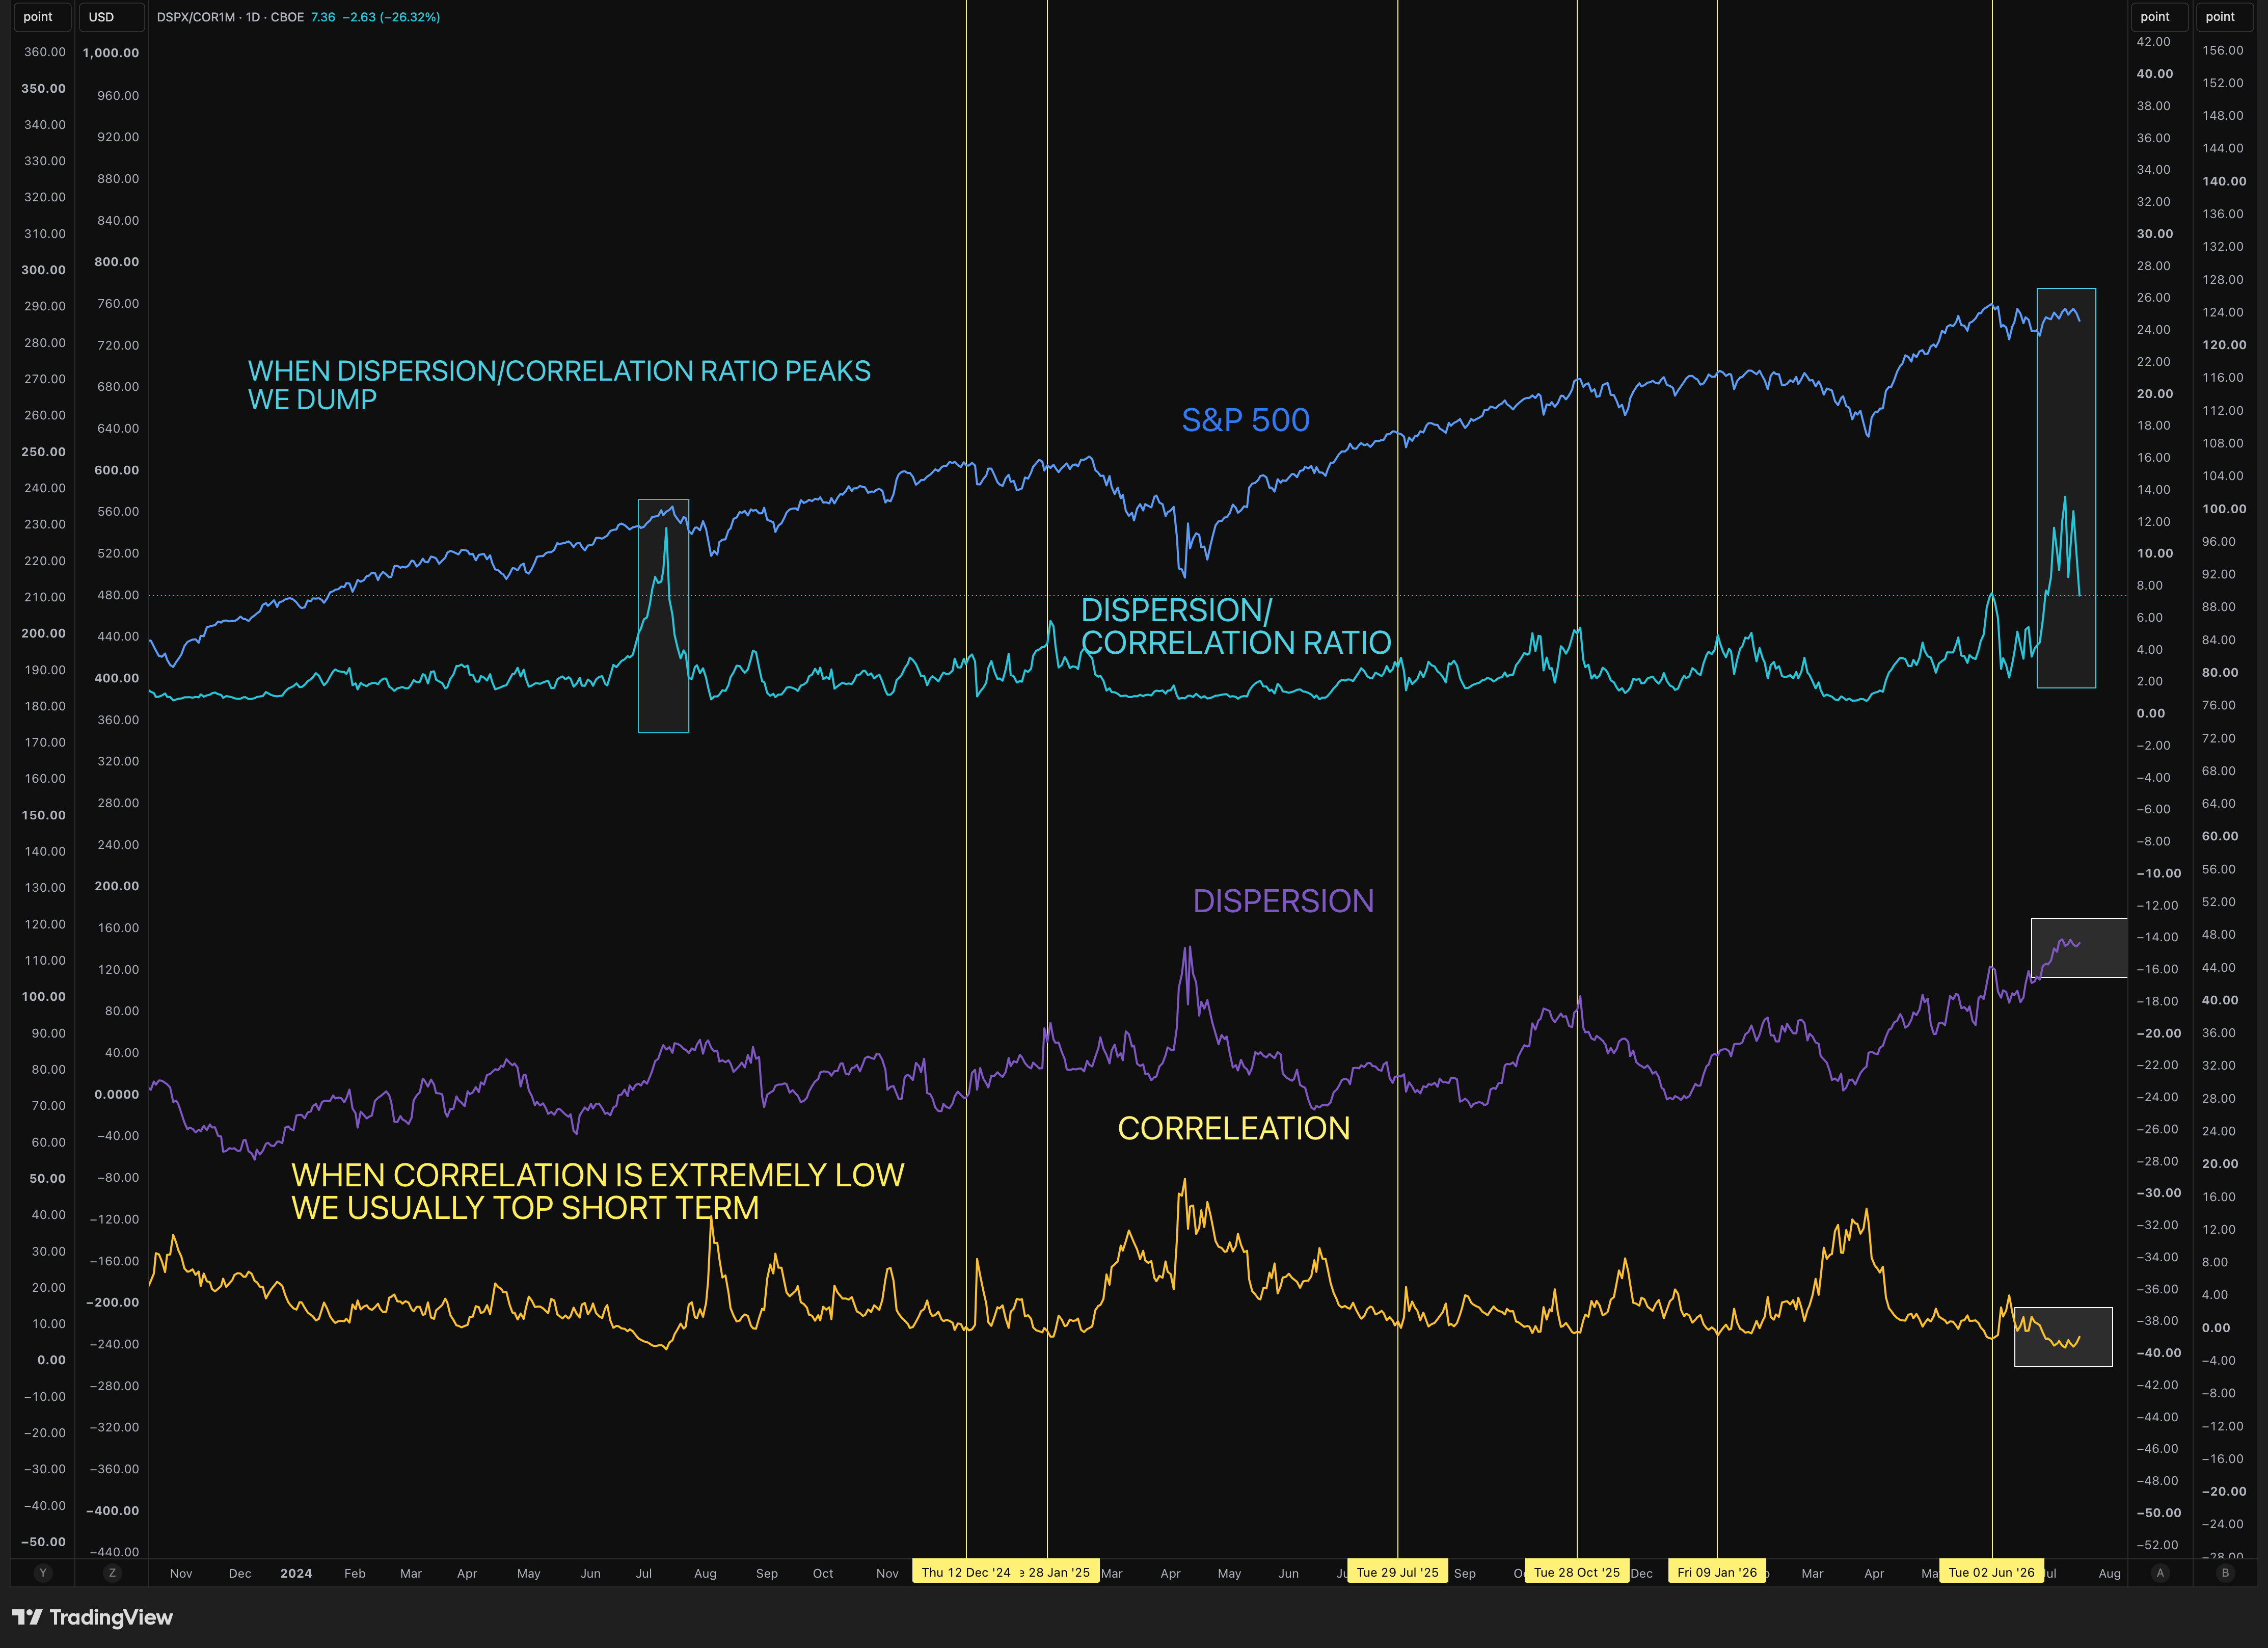
And thats exactly where we are currently. Dispersion is at a historic high, the type of dispersion we often see at capitulation lows or significant tops.
And correlation is finally starting to curl up from a historic low, which causes the ratio of the two to decline.
And the declining phase of the ratio, are the times where the market can suffer more swift downside.
And the most impressive part is that correlation is still very low and the ratio still historically very high despite the tech crash. Which means there is room for further reset of these conditions, often followed by shaky times for the market.
Personally I view this as a significant setup and something I have respect for that adds vulnerability to the market structure short term.
Breadth In Limbo
Breadth is consolidating and in limbo, just like the market.
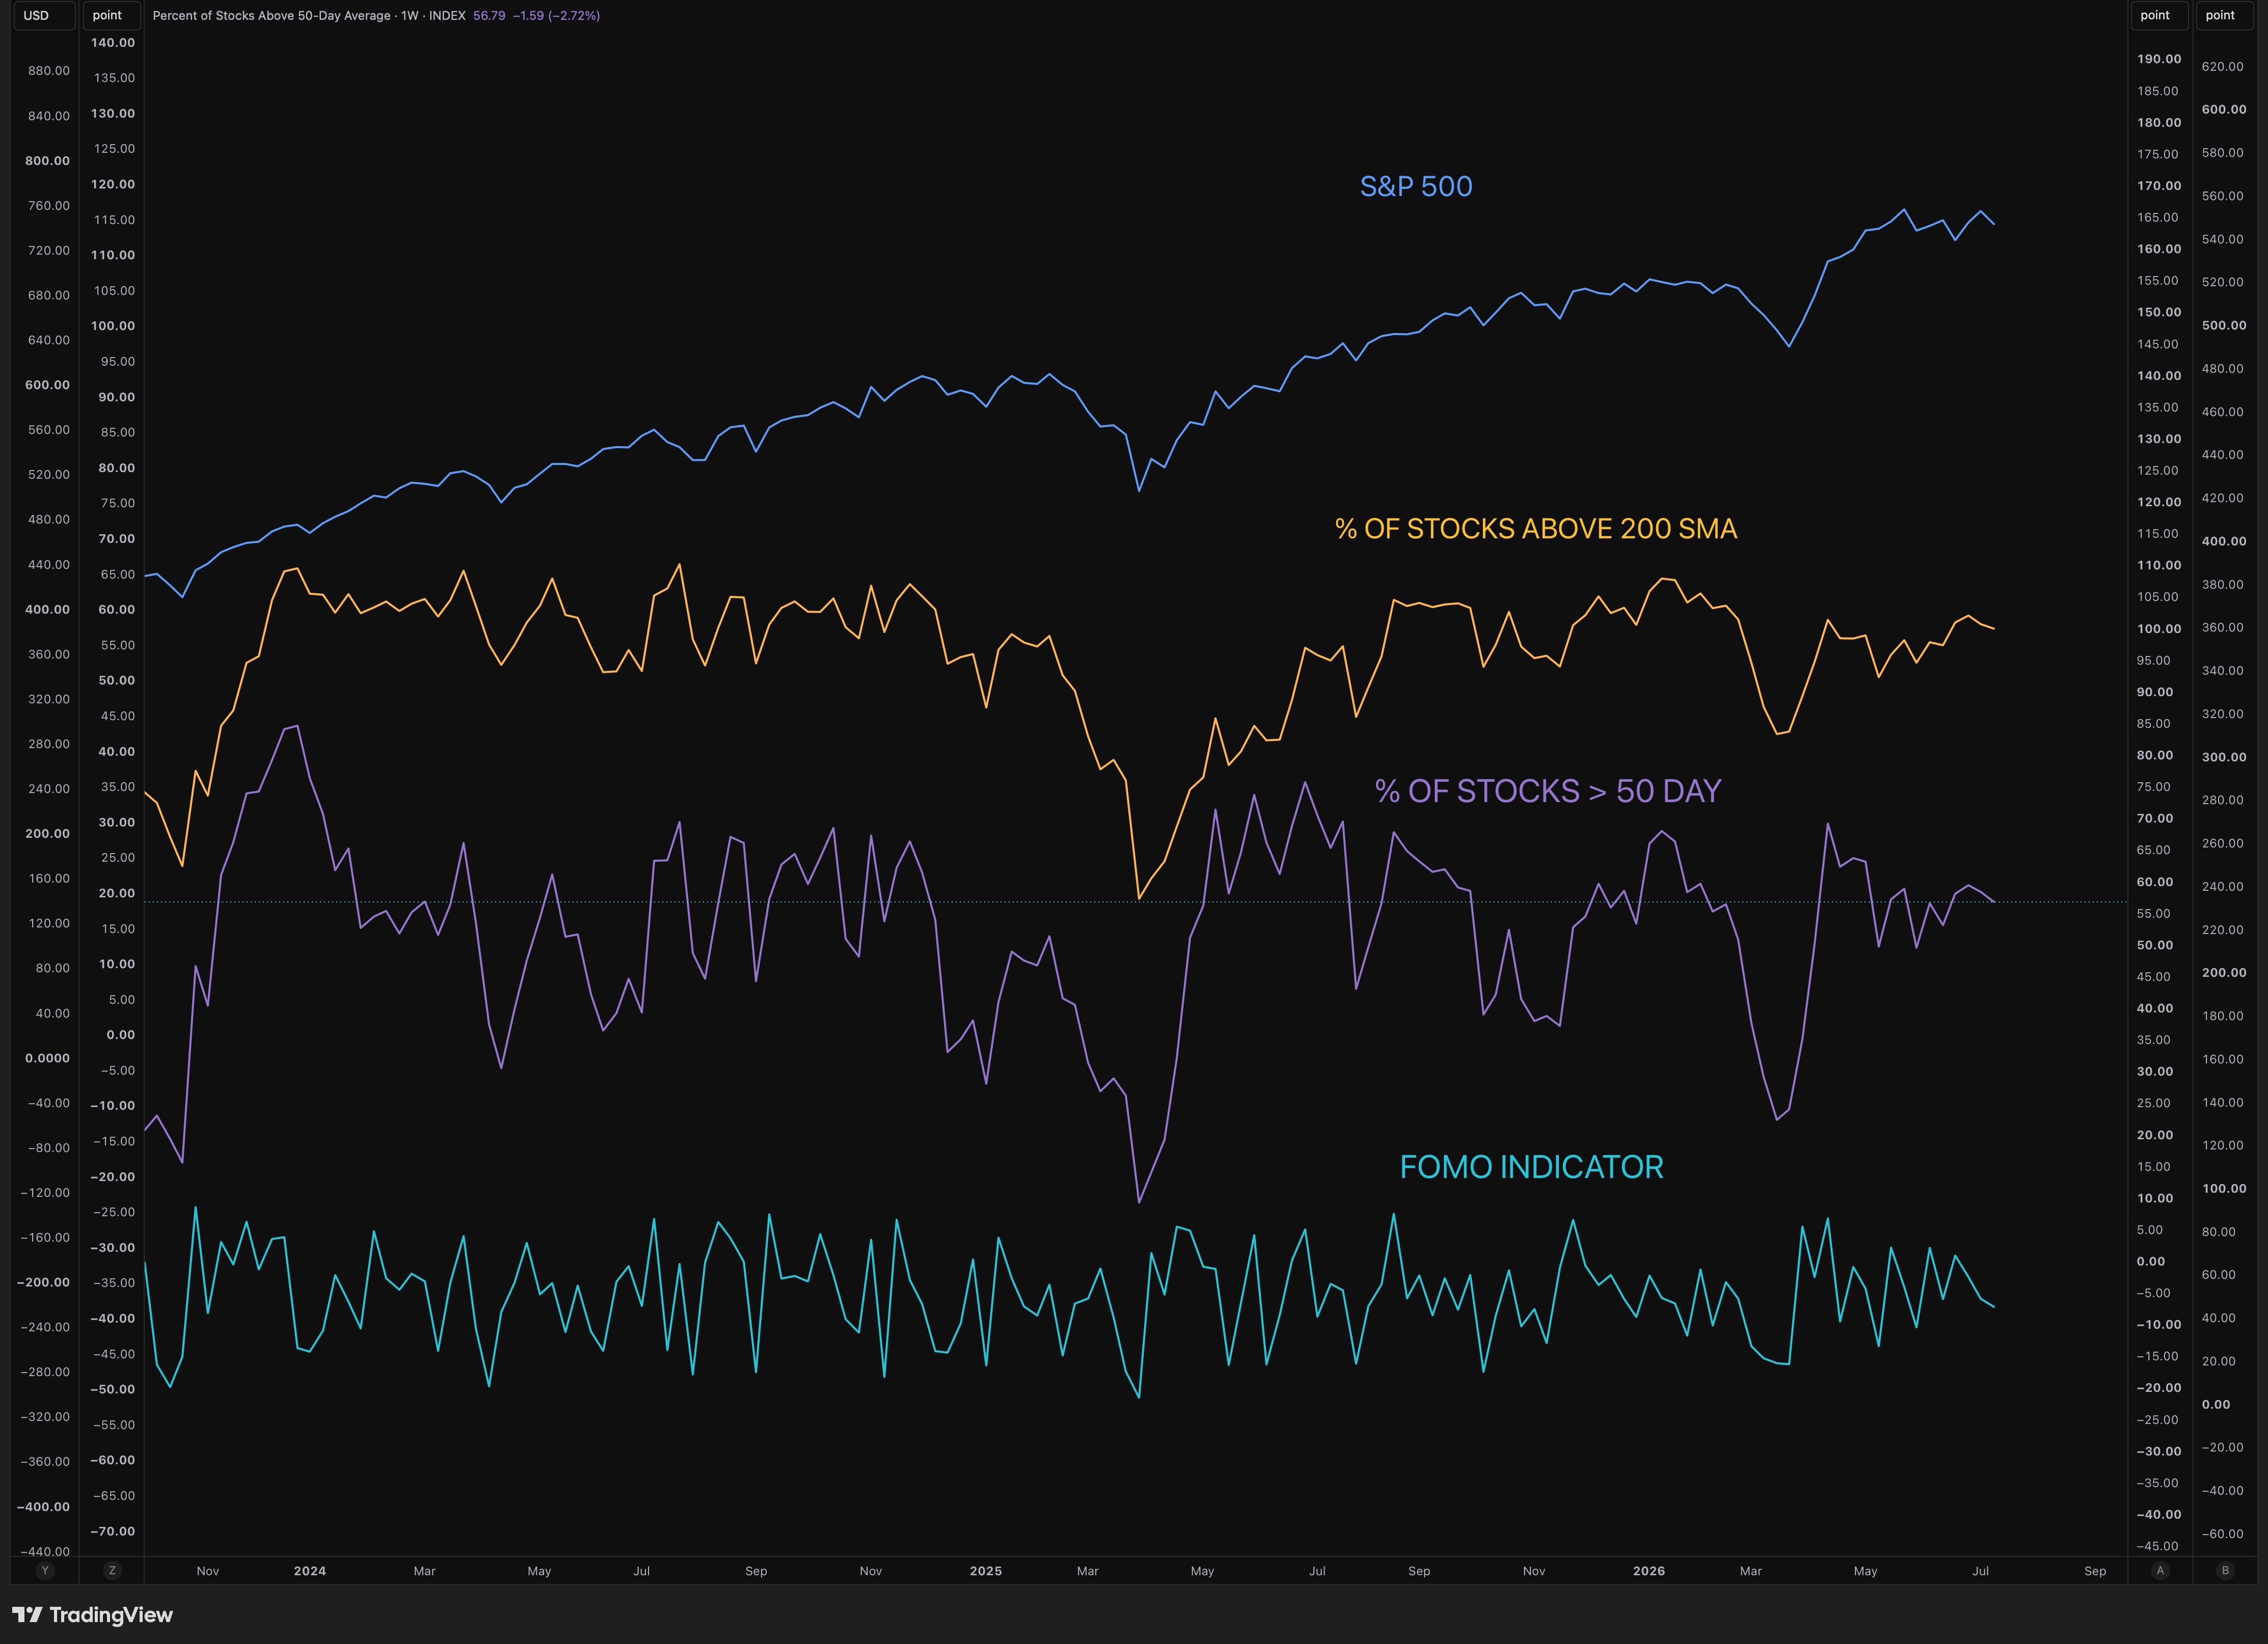
And we can summarize breadth easily this week, oscillating around neutral across all timeframes.
And the real question is if the market can turn and start a new trend while breadth is still this good? Personally I doubt it.
If we continue to hesitate, I expect breadth to have to nosedive to attract new buyers. And after that the market can reset and push higher.
We will see.
No Excessive Rotation Yet But Maybe Starting?
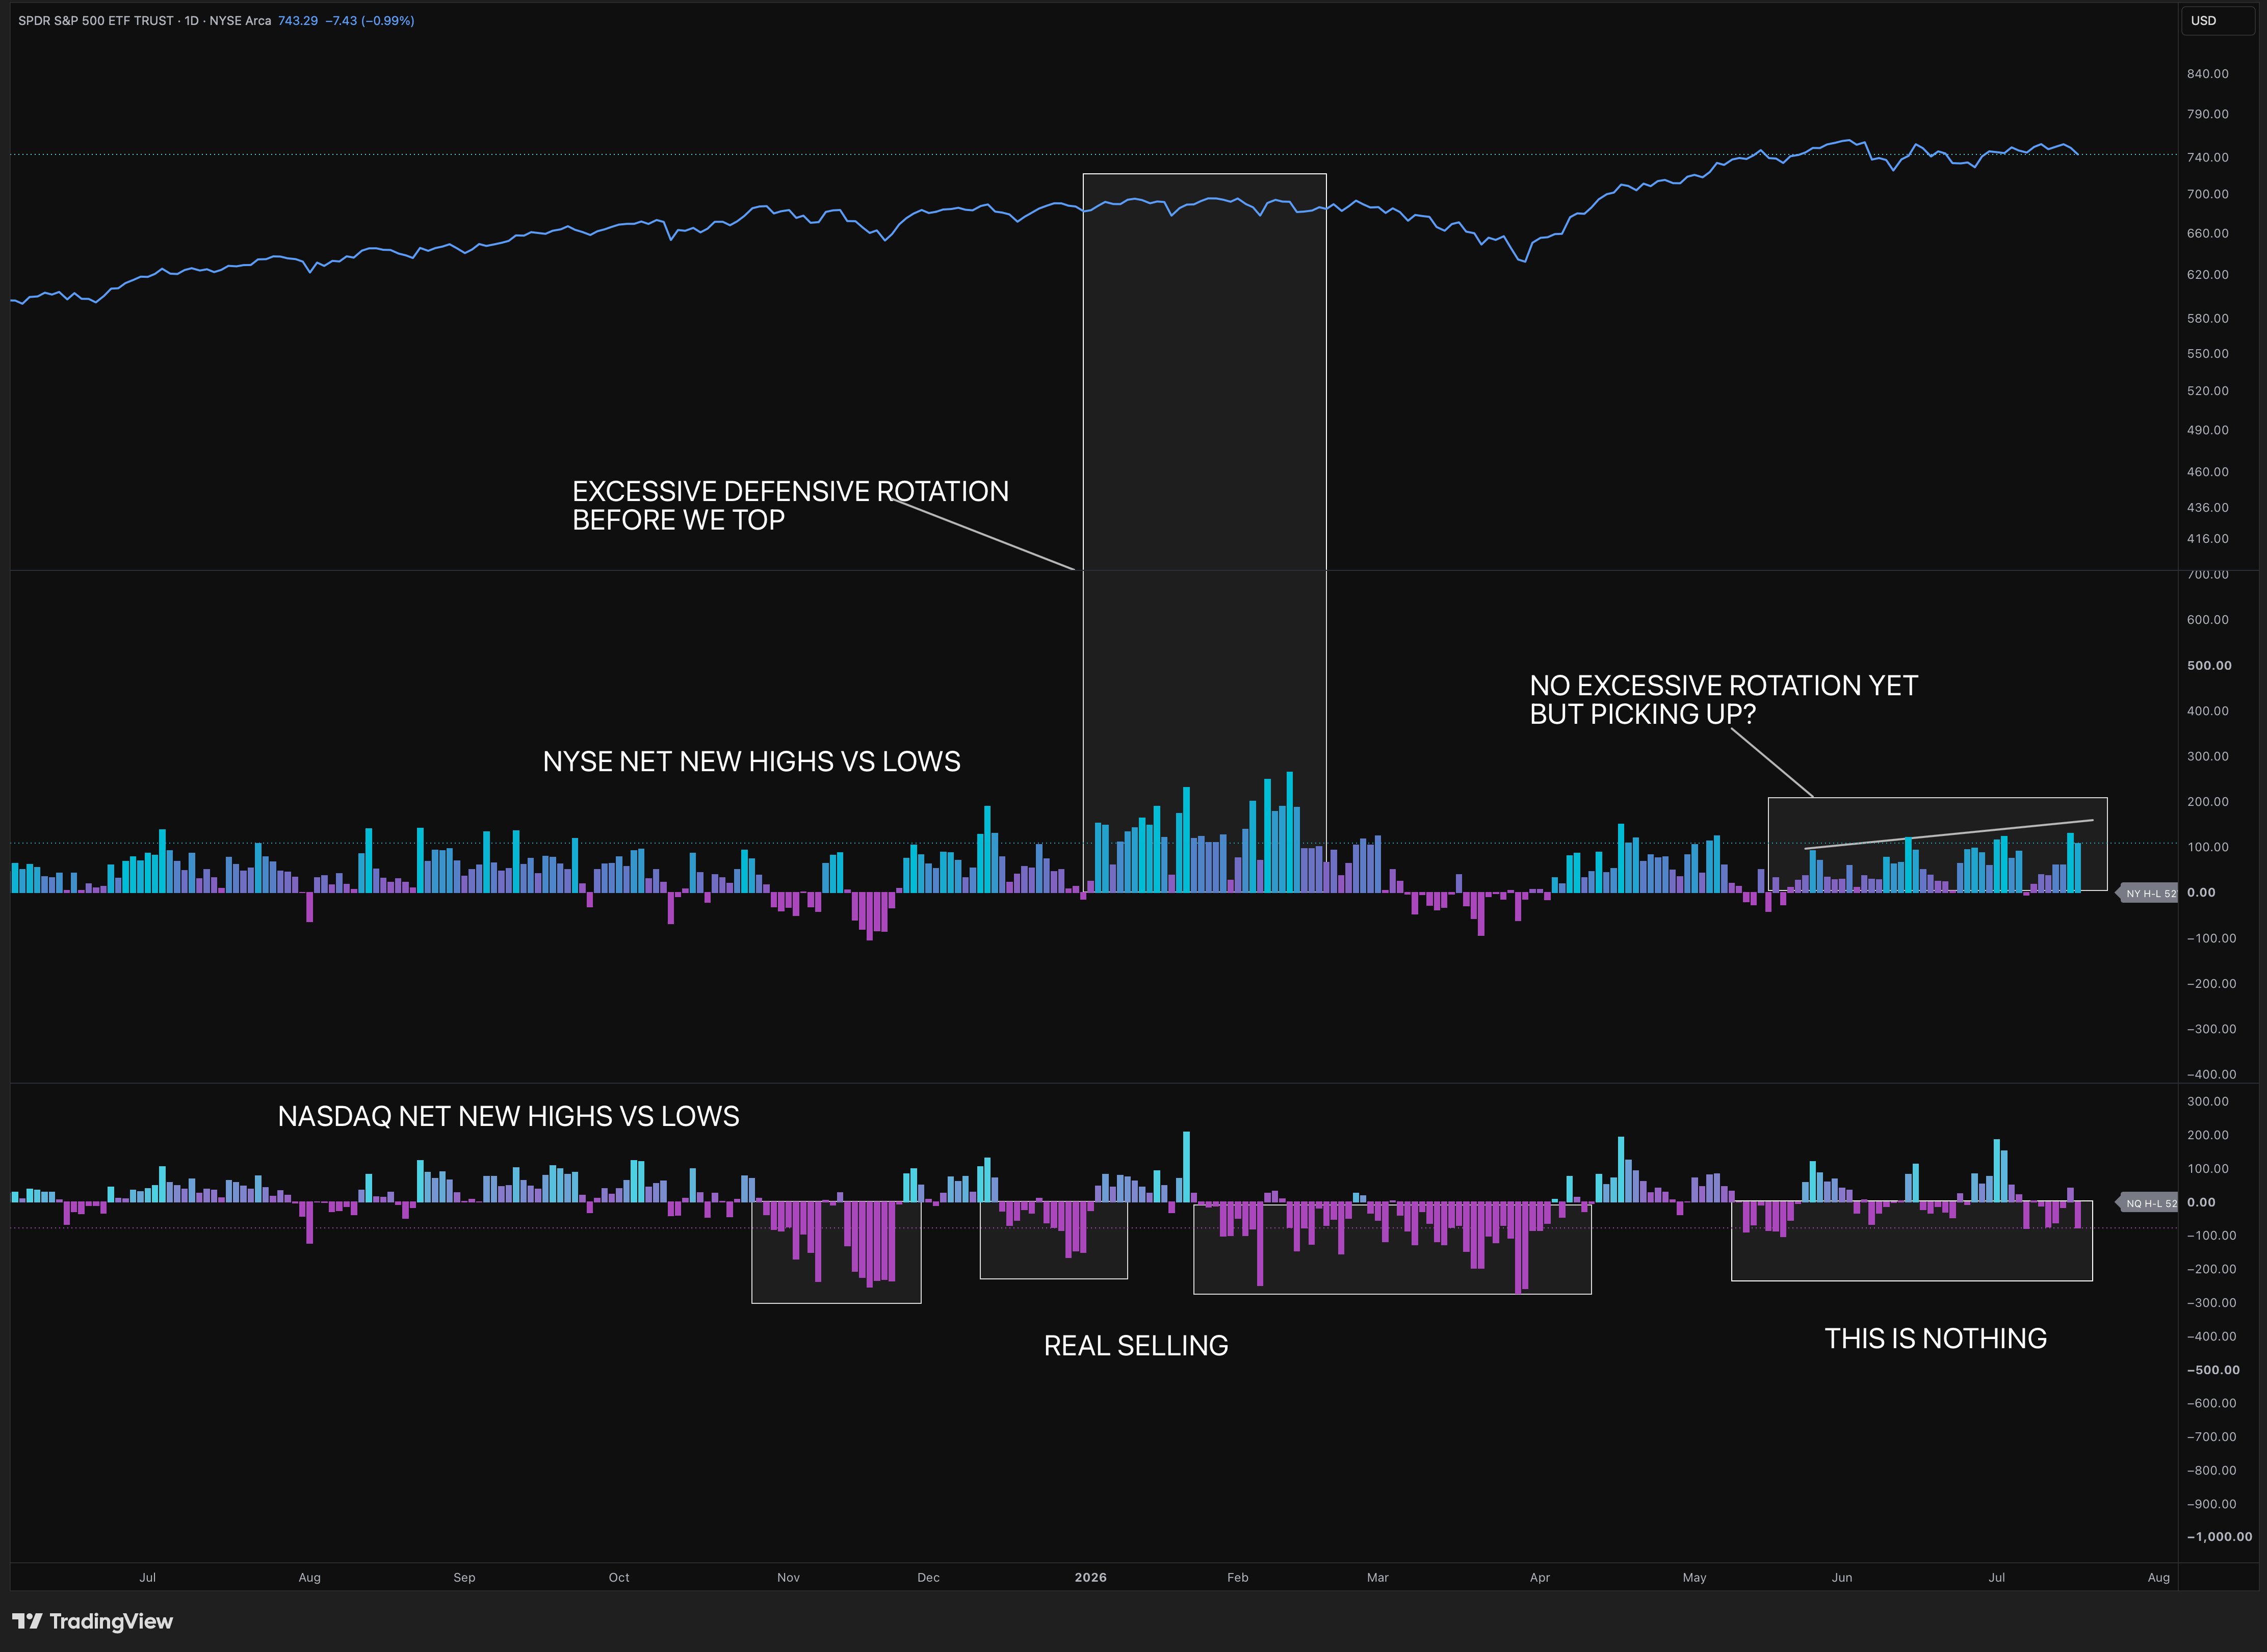
And this is a key dynamic to understand.
Smart money wants to hide and keep their money in equities. They hide by buying defensives and value, until they sell everything, if weakness continues.
That is why we usually see a push higher in breadth and excessive defensive rotation with net new highs exploding higher in the value heavy NYSE.
We saw that at our last top, but we do not see it now yet. But something to watch closely.
We also see continued very limited real selling in the Nasdaq, with net new lows not expanding significantly.
So far this is rotation without massive cracks in the broader market.
VIX Up Cycle Likely Starting
After being complacent VIX popped and so did VVIX. Some hedging is taking place.
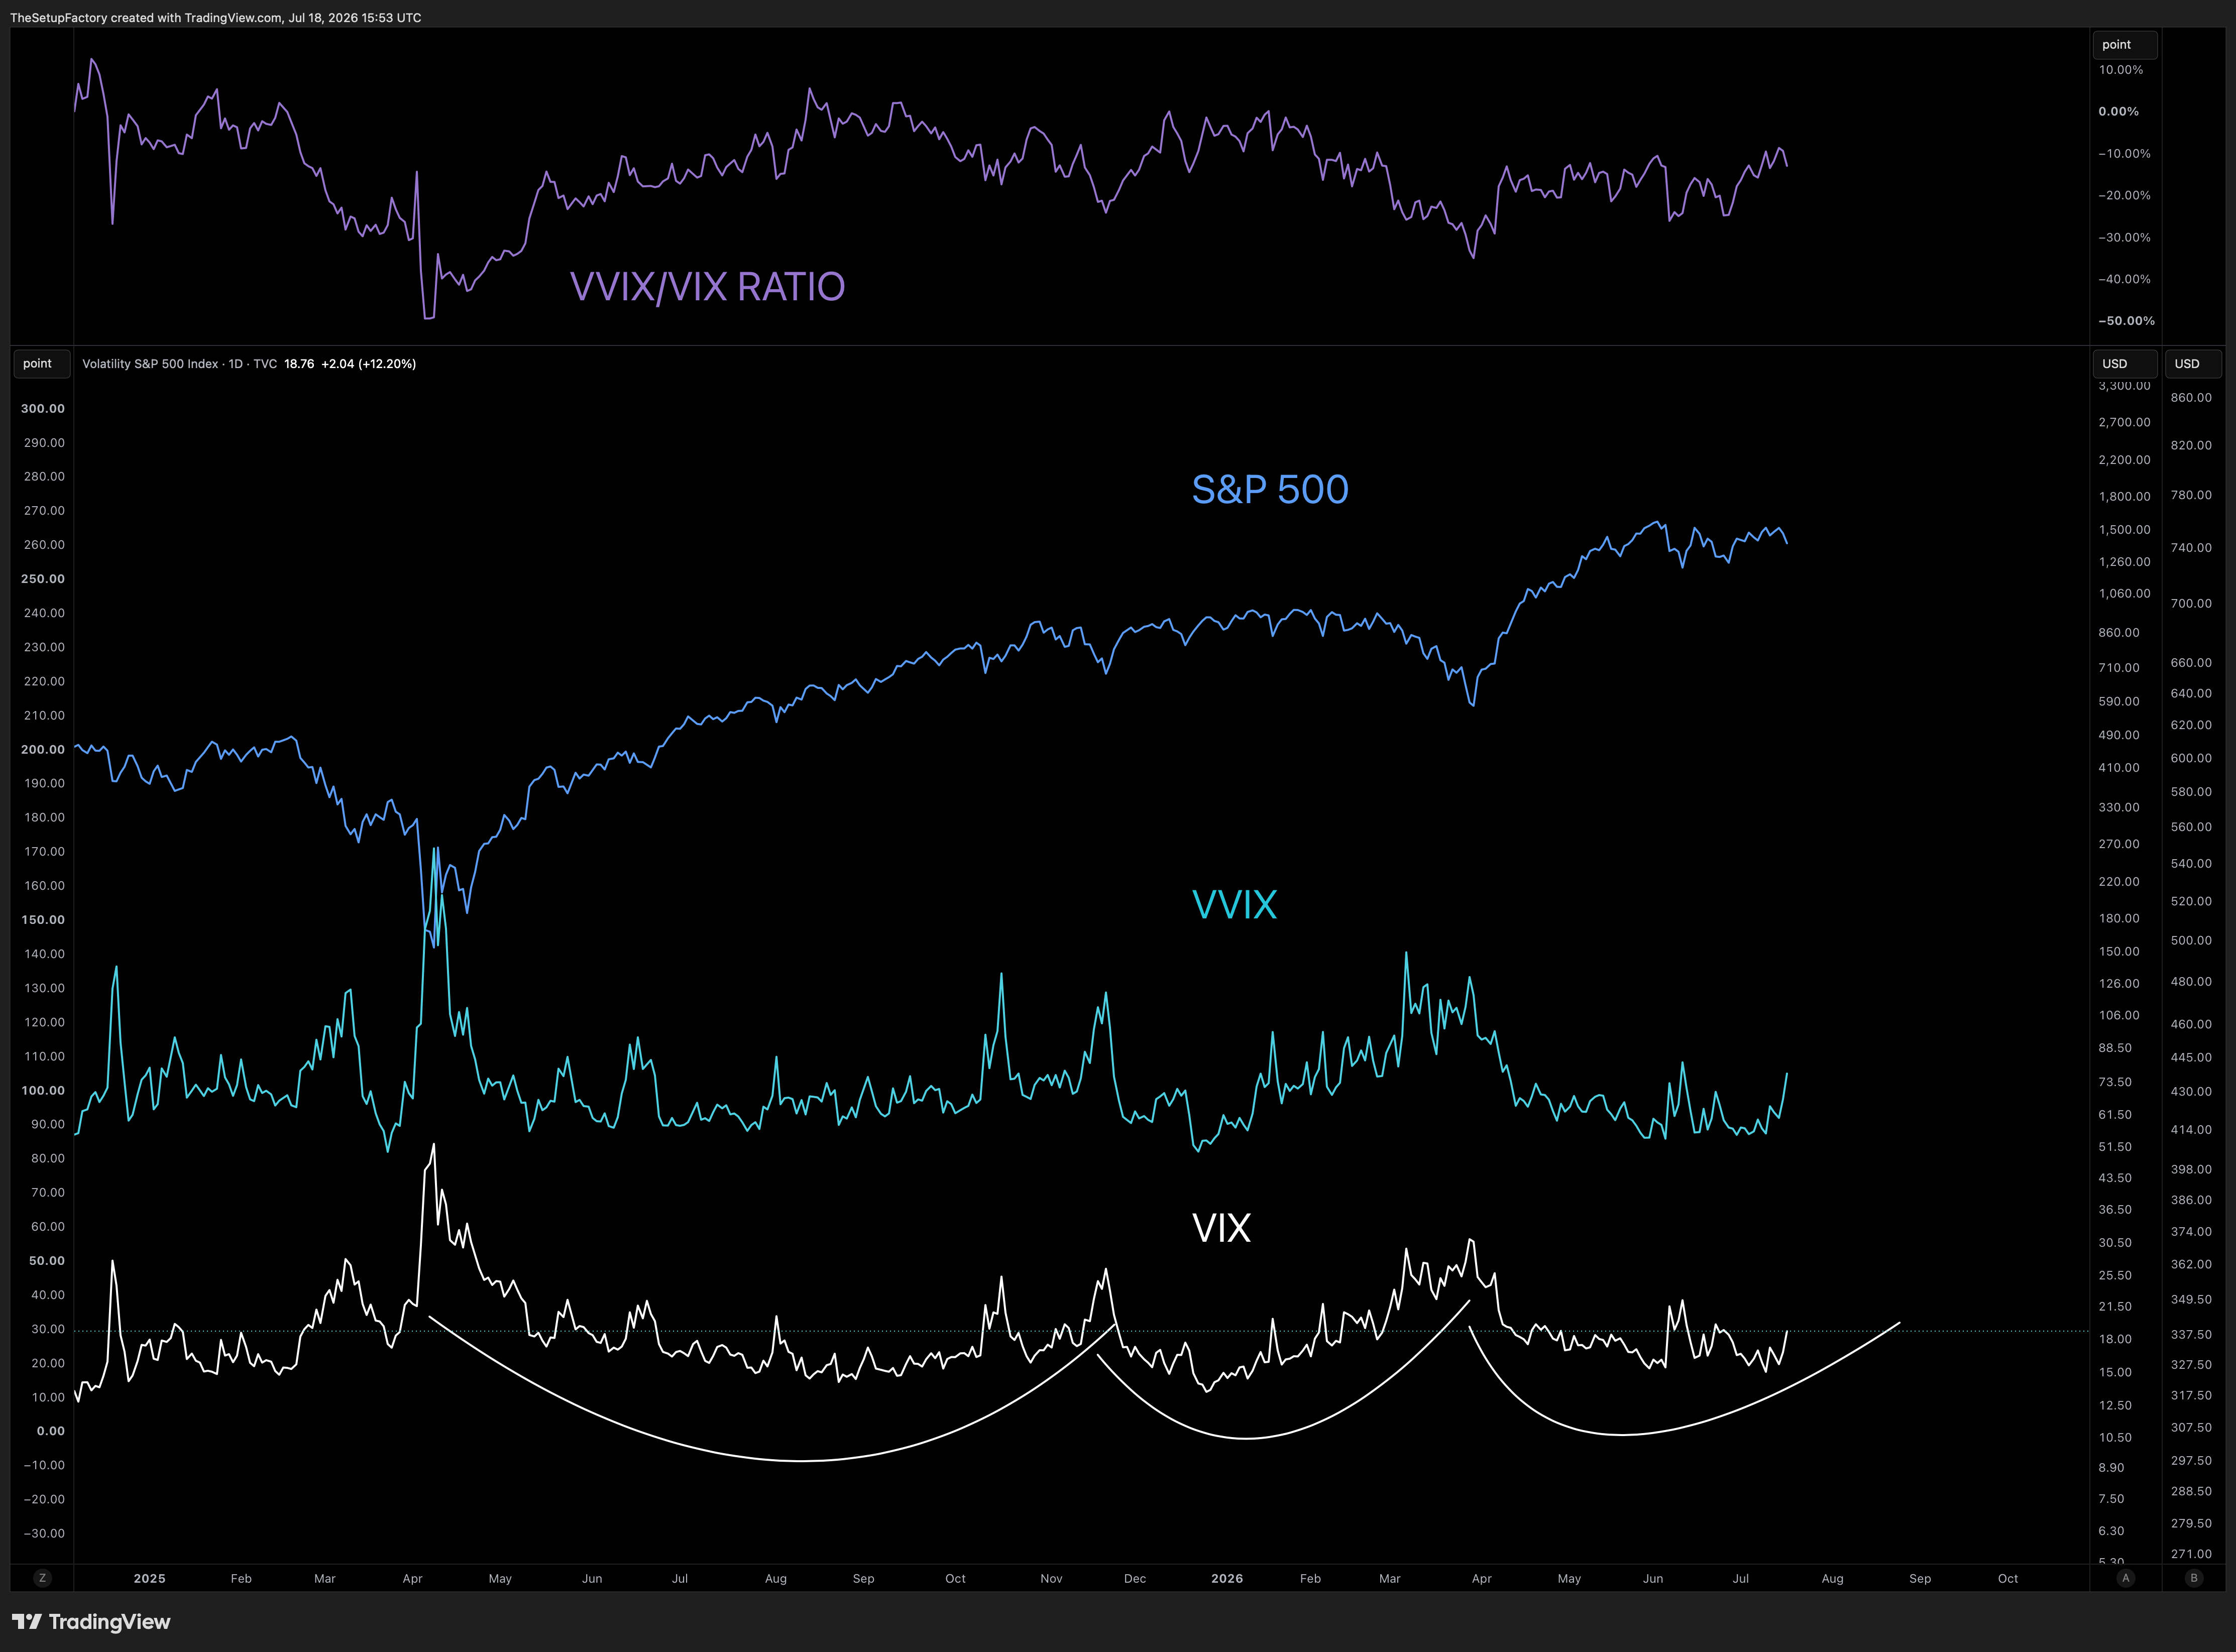
And VIX moves in cycles, and it looks like an up cycle in VIX is starting soon.
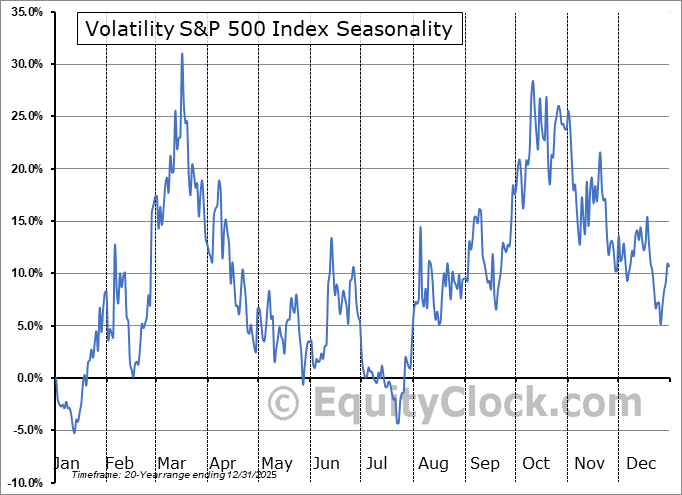
It aligns with seasonality, however we have VIXperation on Wednesday and I would be surprised for a new vol collapse after that marking the yearly low for VIX until it continues higher after that.
But in summary VIX popped, we need that pop to not last and fade for equities to perform short term.
AAII Bulls Very Bullish
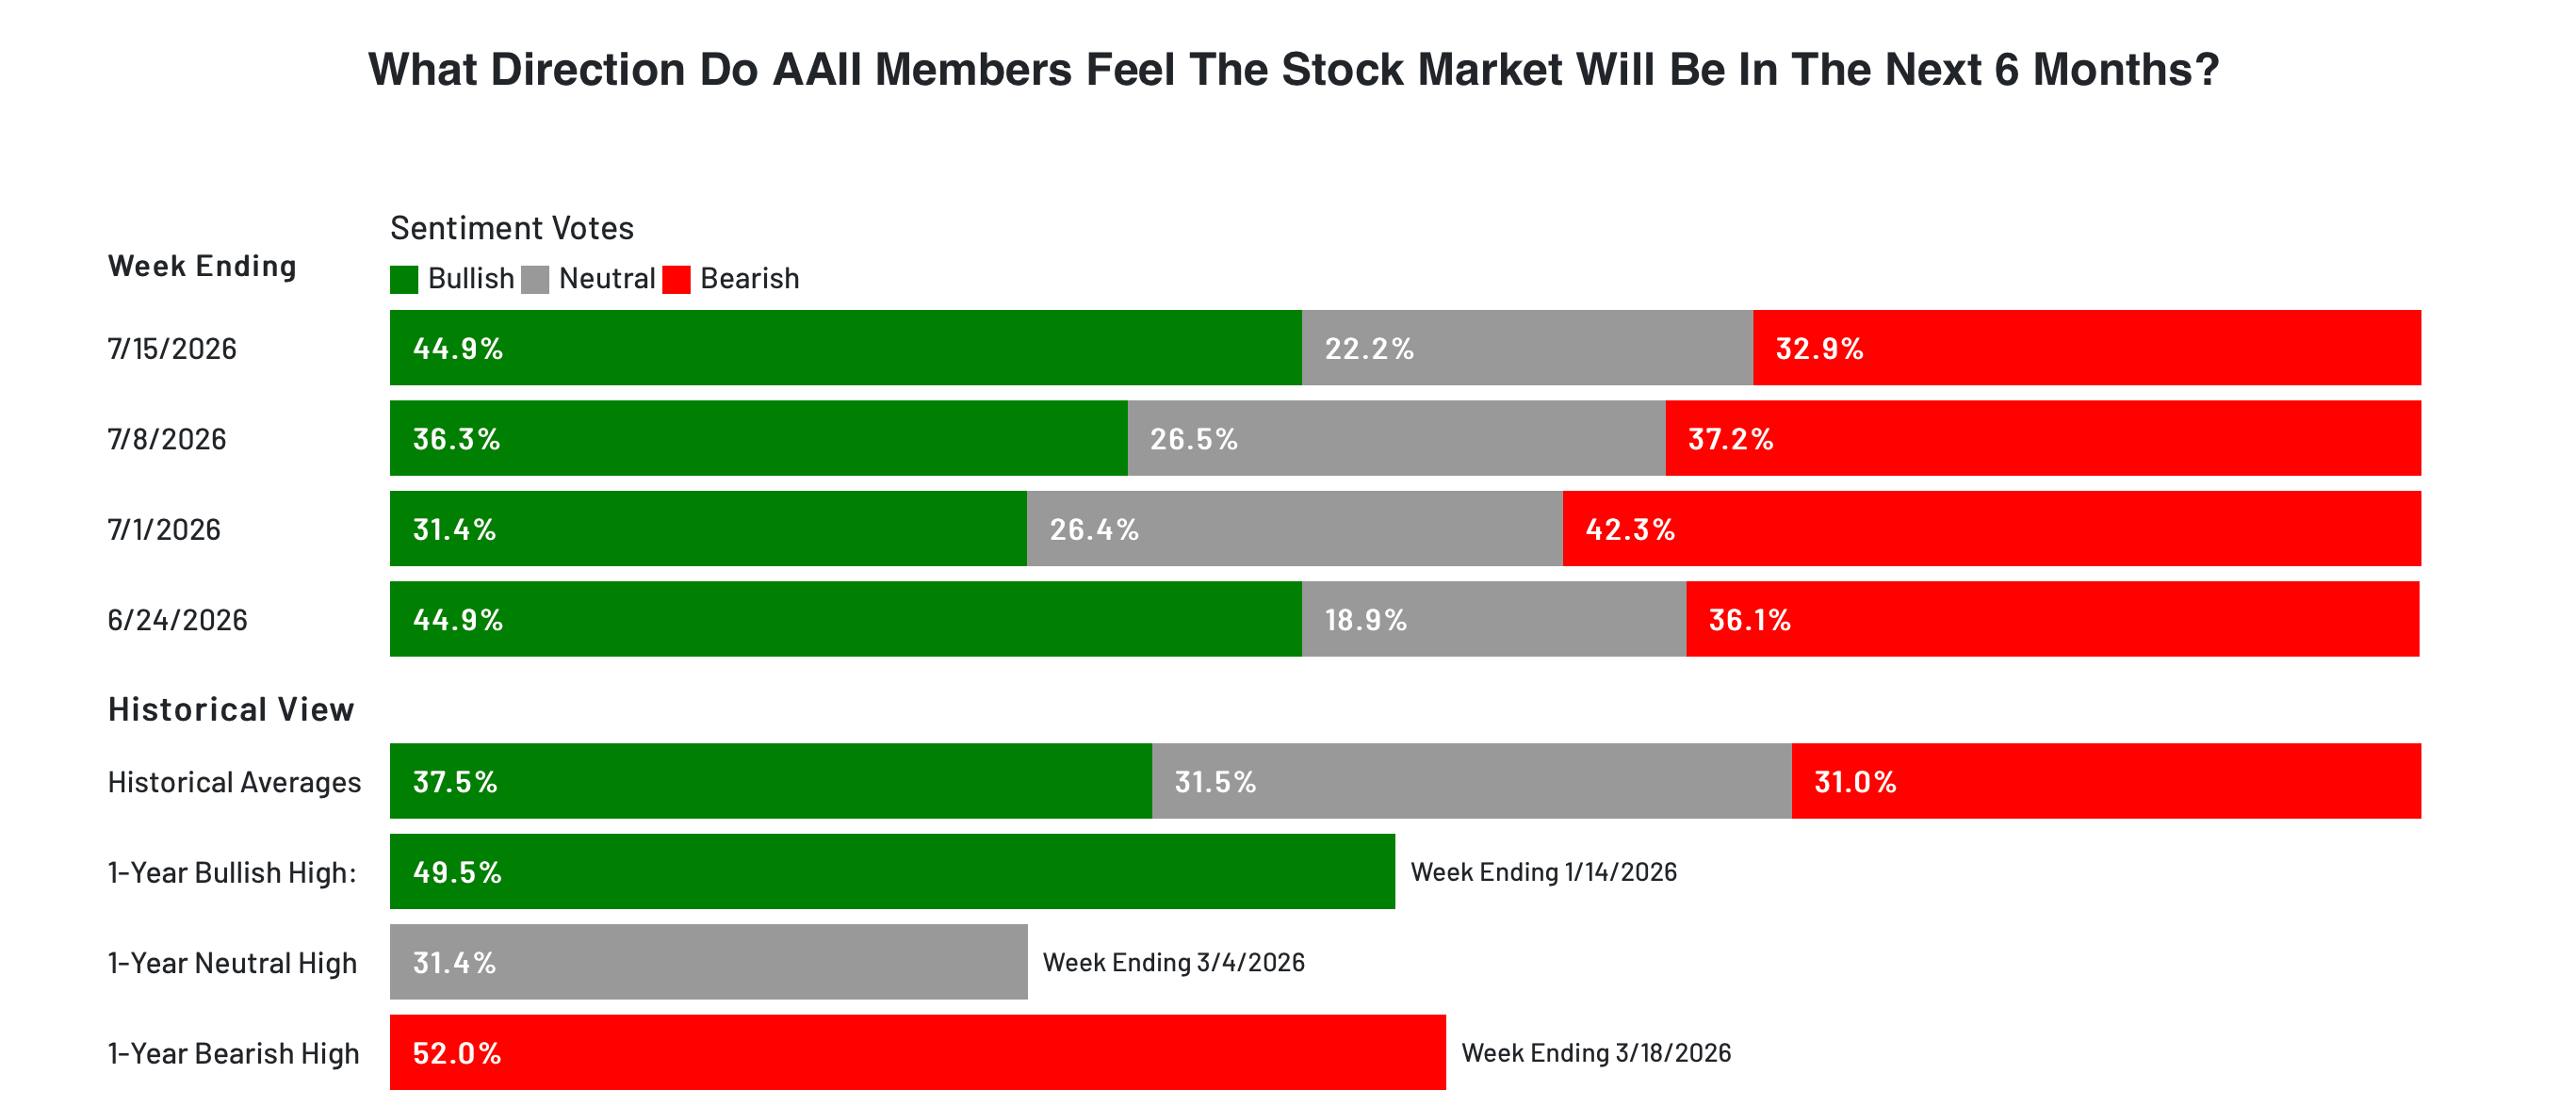
Close to the 1 year bullish high. And since we look at AAII every week, I thought it would be nice with some data. Is this really a bad thing?
Here we buy when AAII bulls cross above 44% like now and we look back in all history.
(Source: SentimenTrader.com)


Not great short term, a coin flip and mostly chop.
NAAIM 95.6% Long
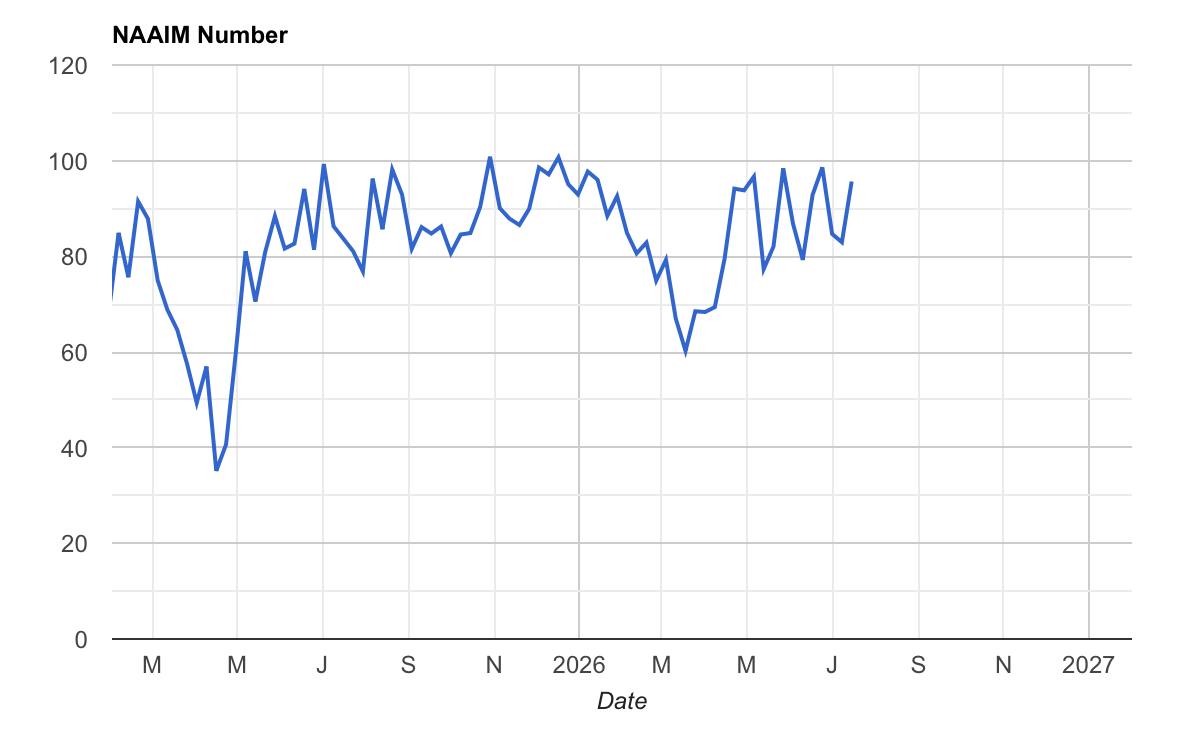
Almost max bullish. Zero dent in sentiment despite this chop.
Actually I am pretty surprised by that, but that's the case.
Credit Spreads Trending Higher
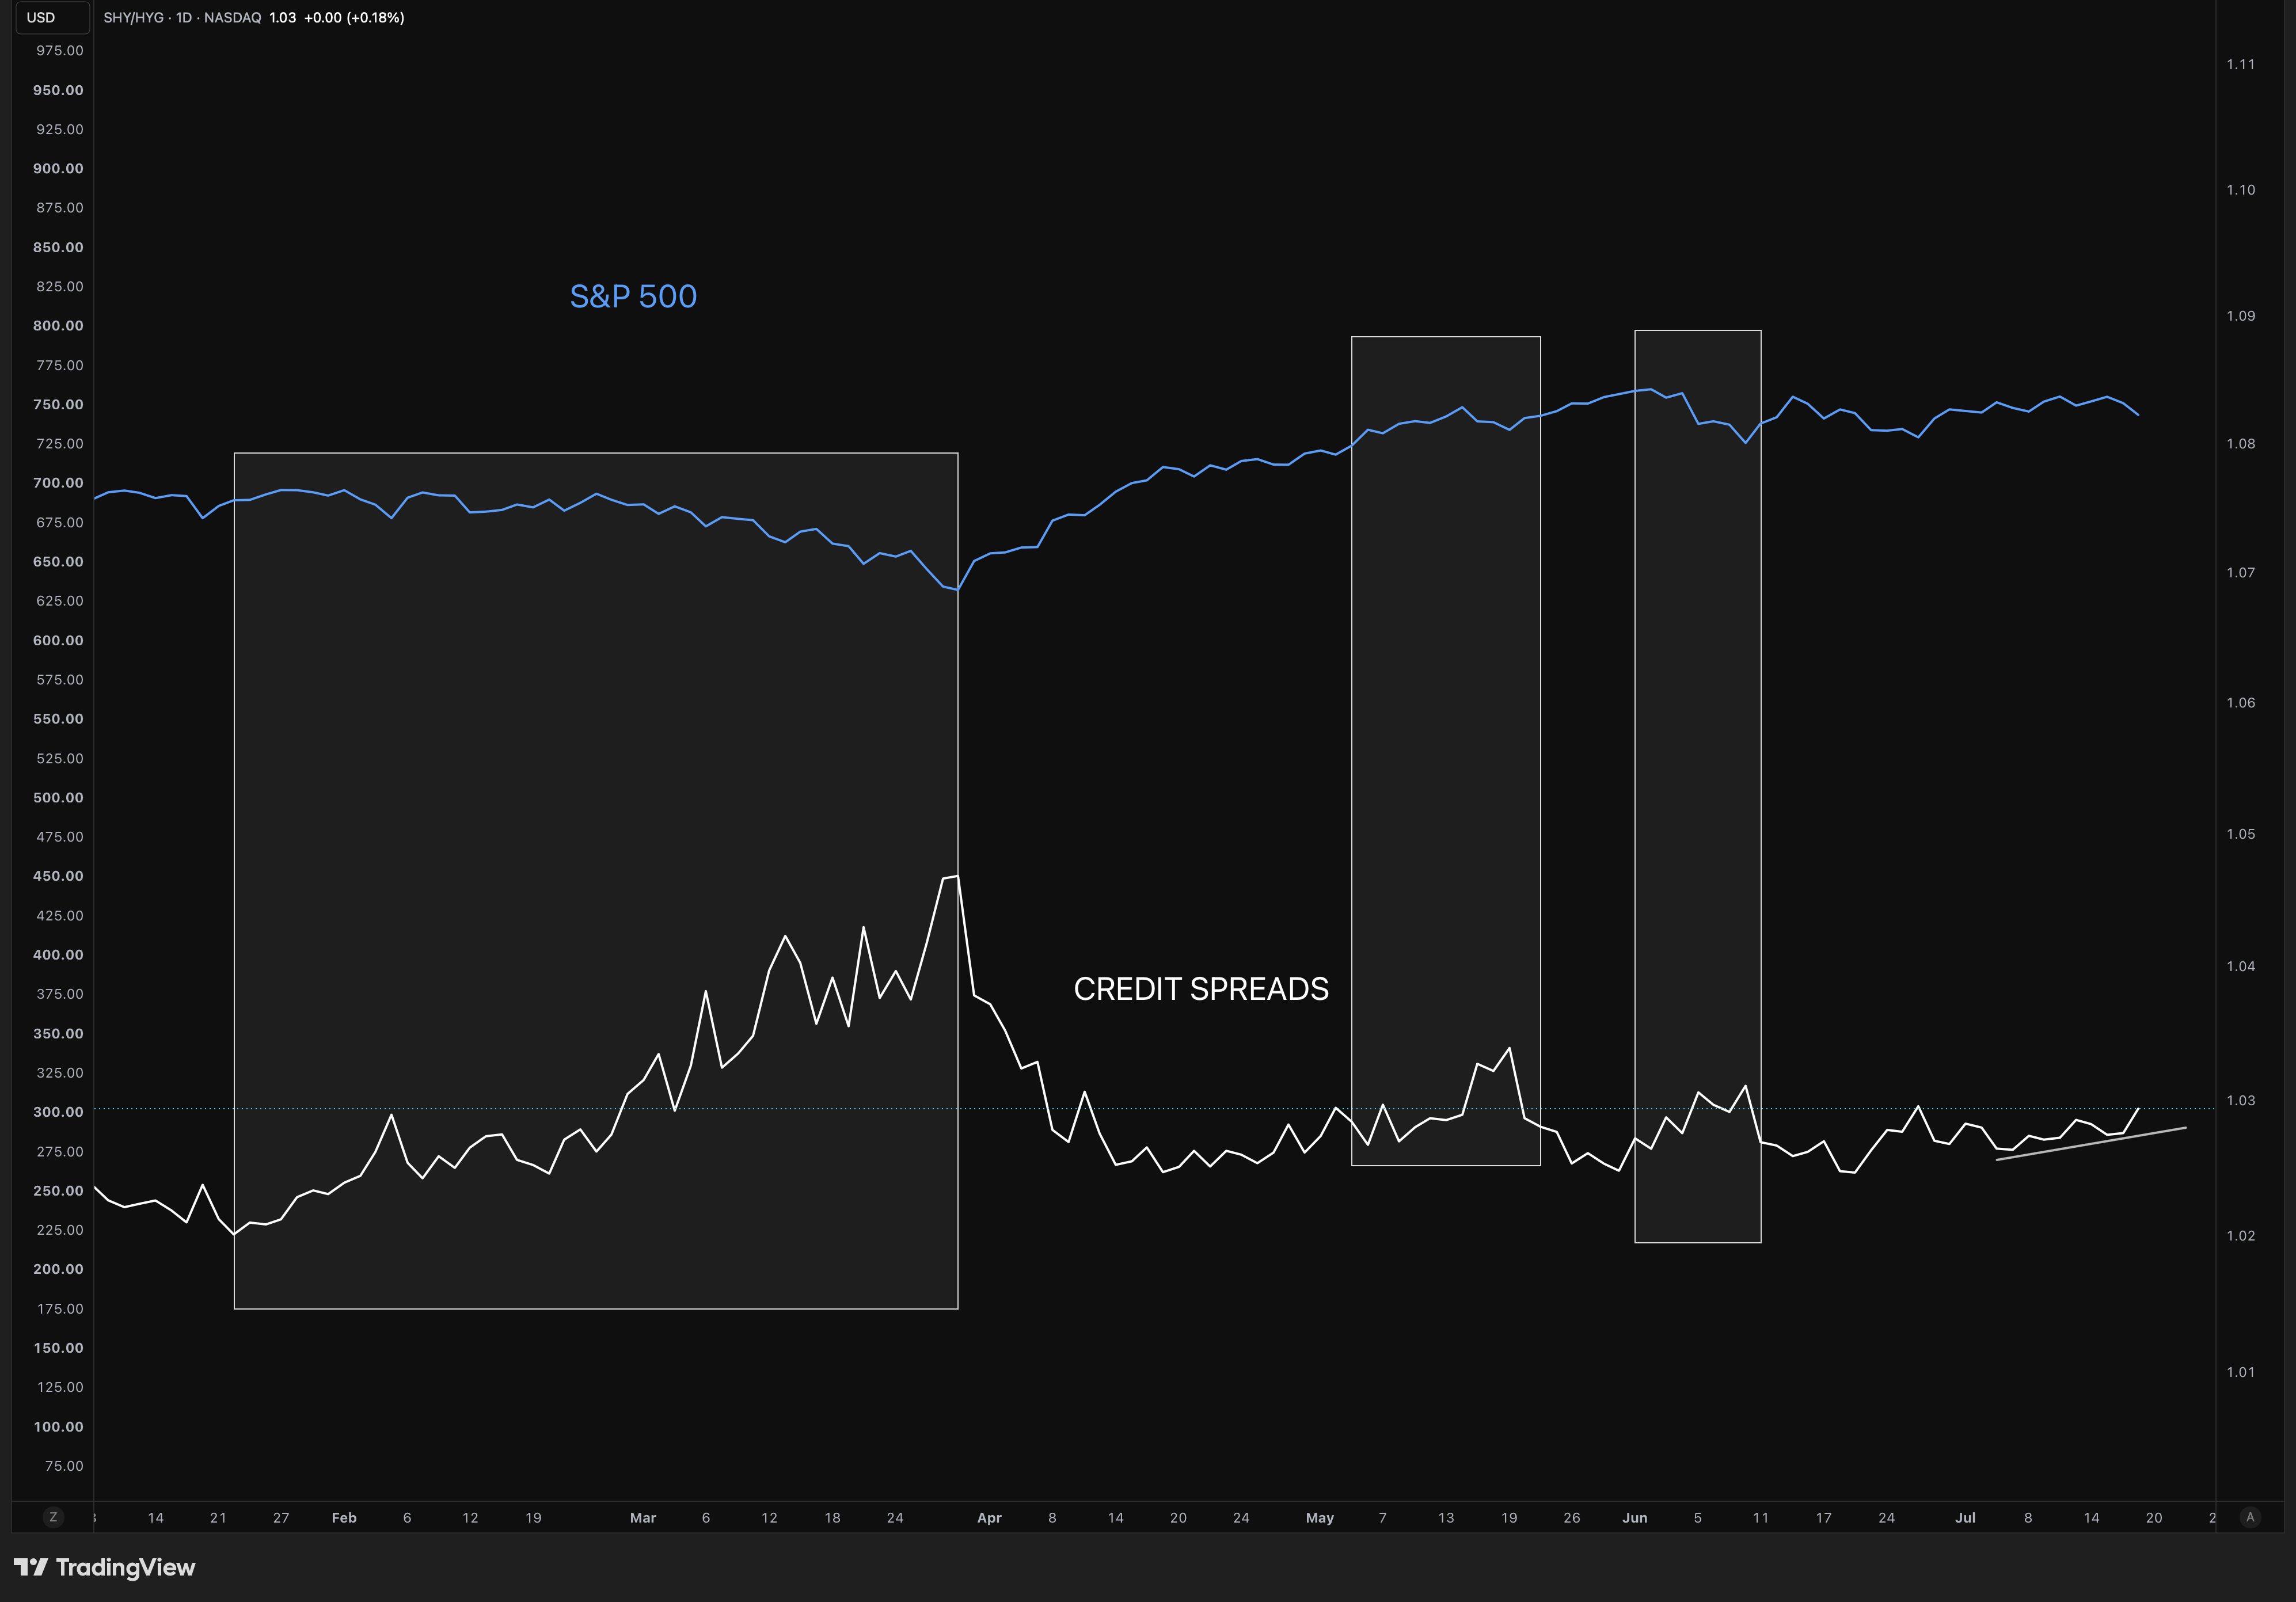
And when they do the environment is always more difficult and declines more common.
IPOs Finally Showing Some Weakness
One of the most important things to track is the relative performance of IPOs compared to the broad market.
Because when true risk off starts, smart money will sell their speculative IPOs first, and the rest of their stocks later.
We therefore often see an aggressive dump in this ratio before the real decline starts in the broad market.
And we have used this signal several times to anticipate declines.
(Source: SentimenTrader.com)
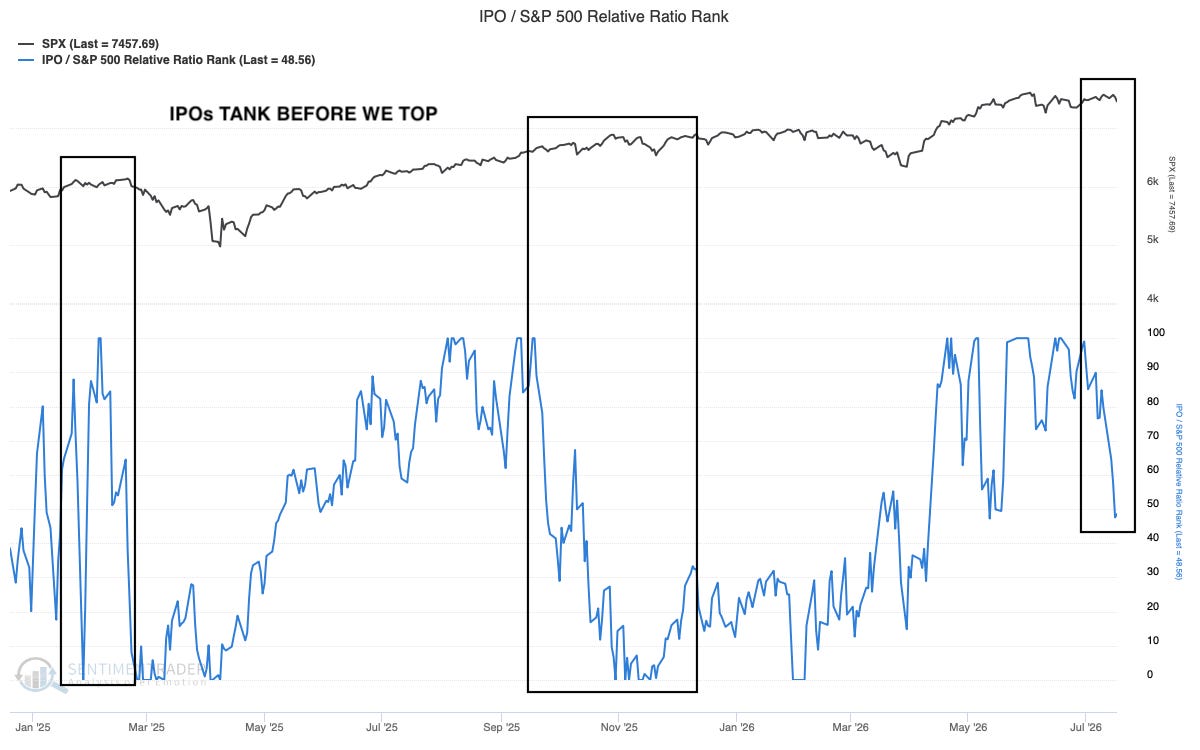
Still a chance for bulls to turn this, not the extreme decline yet seen at prior tops.
But still a clear crack in the broad risk appetite. Weakness is not only limited to the semis.
A continued dump here would make me extremely cautious.
Super Strength In S&P 500
I don’t think we are at peak rotation trade looking at the bigger picture, but short term we might be at the peak.
Here we look at number of stocks within the S&P 500 showing very strong relative outperformance to the S&P 500.
And we see a clear broadening, the problem is that when too many stocks within the S&P 500 perform well, we are usually close to short term weakness.
(Source: SentimenTrader.com)
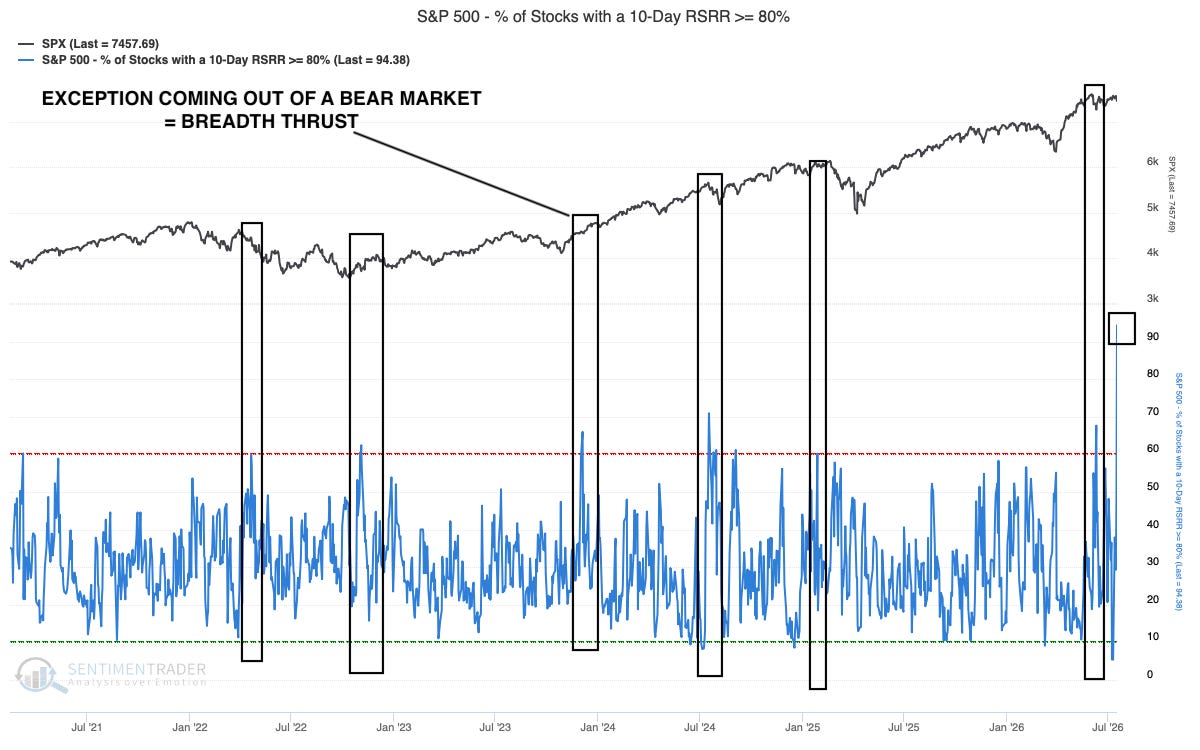
Major burst in outperformance in S&P 500 stocks which is a product of aggressive rotation.
Unsustainable levels of outperformance. And interestingly if we get a breadth thrust together with this signal, it can be bullish.
Personally I am interpreting it with a bearish lean currently, I think bid will soon exhaust into the defensives short term which makes the market prone to short term weakness.
But I remain open minded, lets see.
A Common Misconception About The A/D Line
So much talk about the A/D - line making new highs everywhere you look if you follow anything related to finance.
And I am here to tell you to repeat after me:
The market always tops after a new high in A/D-line.
(Source: SentimenTrader.com)
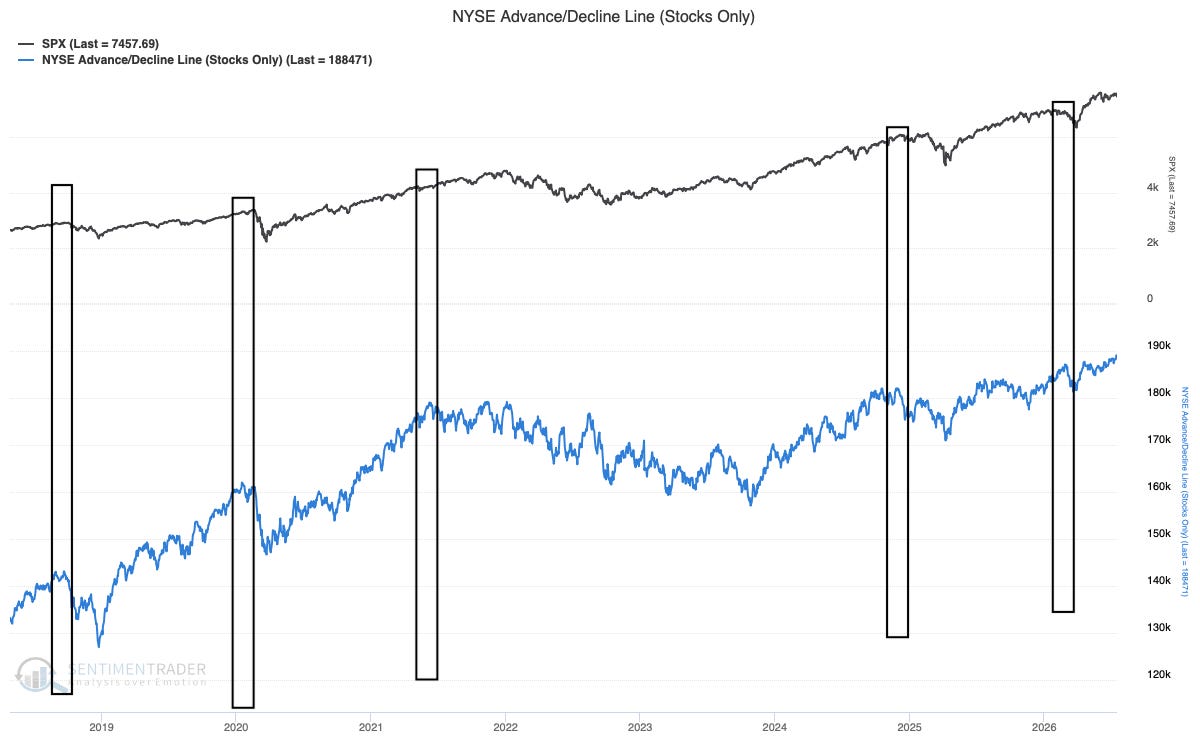
It is not an insurance that the top isn’t in, it might postpone it a bit, but all tops occur after the A/D-line puts in a new high.
This is important to understand.
Corporate Insiders Buying Two Sectors Aggressively
Insiders are always interesting to track, they are usually good market timers when looking at the bigger picture.
And they are buying tech and healthcare aggressively. This is a good sign, last time we topped we saw tech insider unloading some before topping, the same was seen before the tariff top.
(Source: SentimenTrader.com)
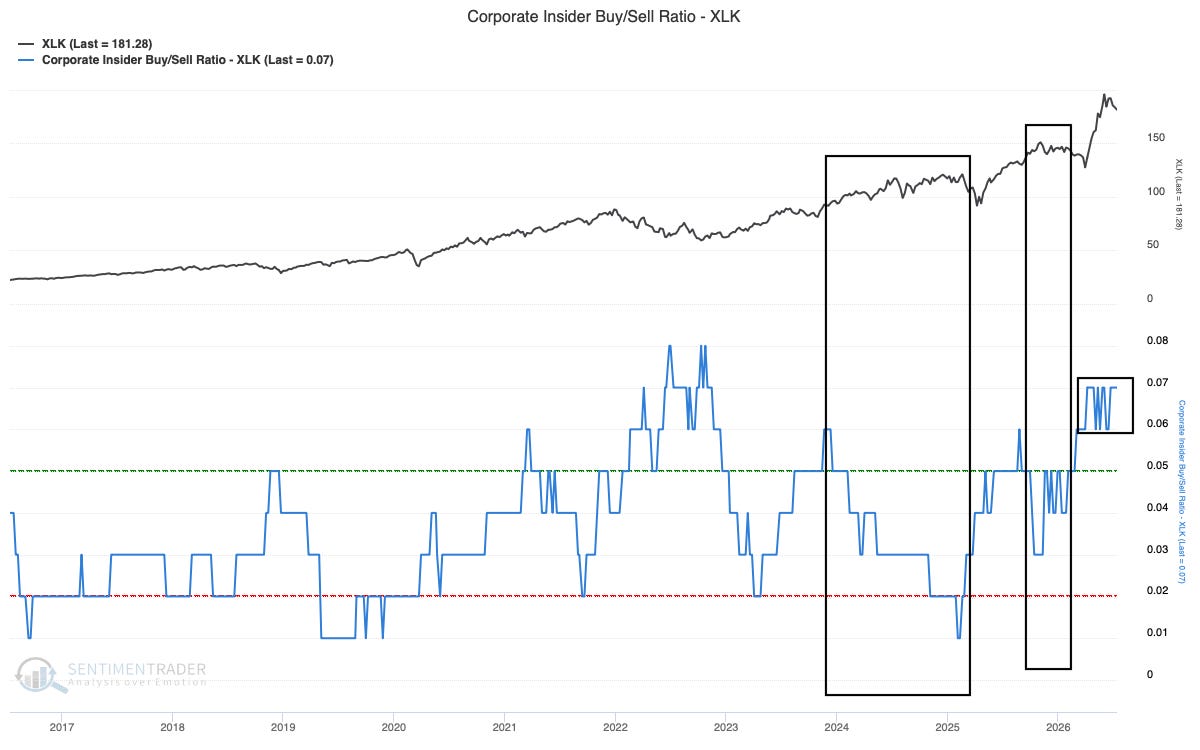
We do not see that now.
Price Action Of Individual Stocks
We see tricky conditions, the rotation trade is weakening and we see fades in all sectors.
We also see the prior leaders declining swiftly, many will just say it’s the semi weakness.
But when all stocks that lead the market out of the April correction breaks down under the weekly 10 SMA on high volume like now — that is a significant event.
We need to closely watch the new emerging leading themes like cybersecurity, software and healthcare to see if they can continue to trend and really take over the leadership.
But summarizing, price action is poor and setups are scarce within growth.
TSF - Market Regime Model
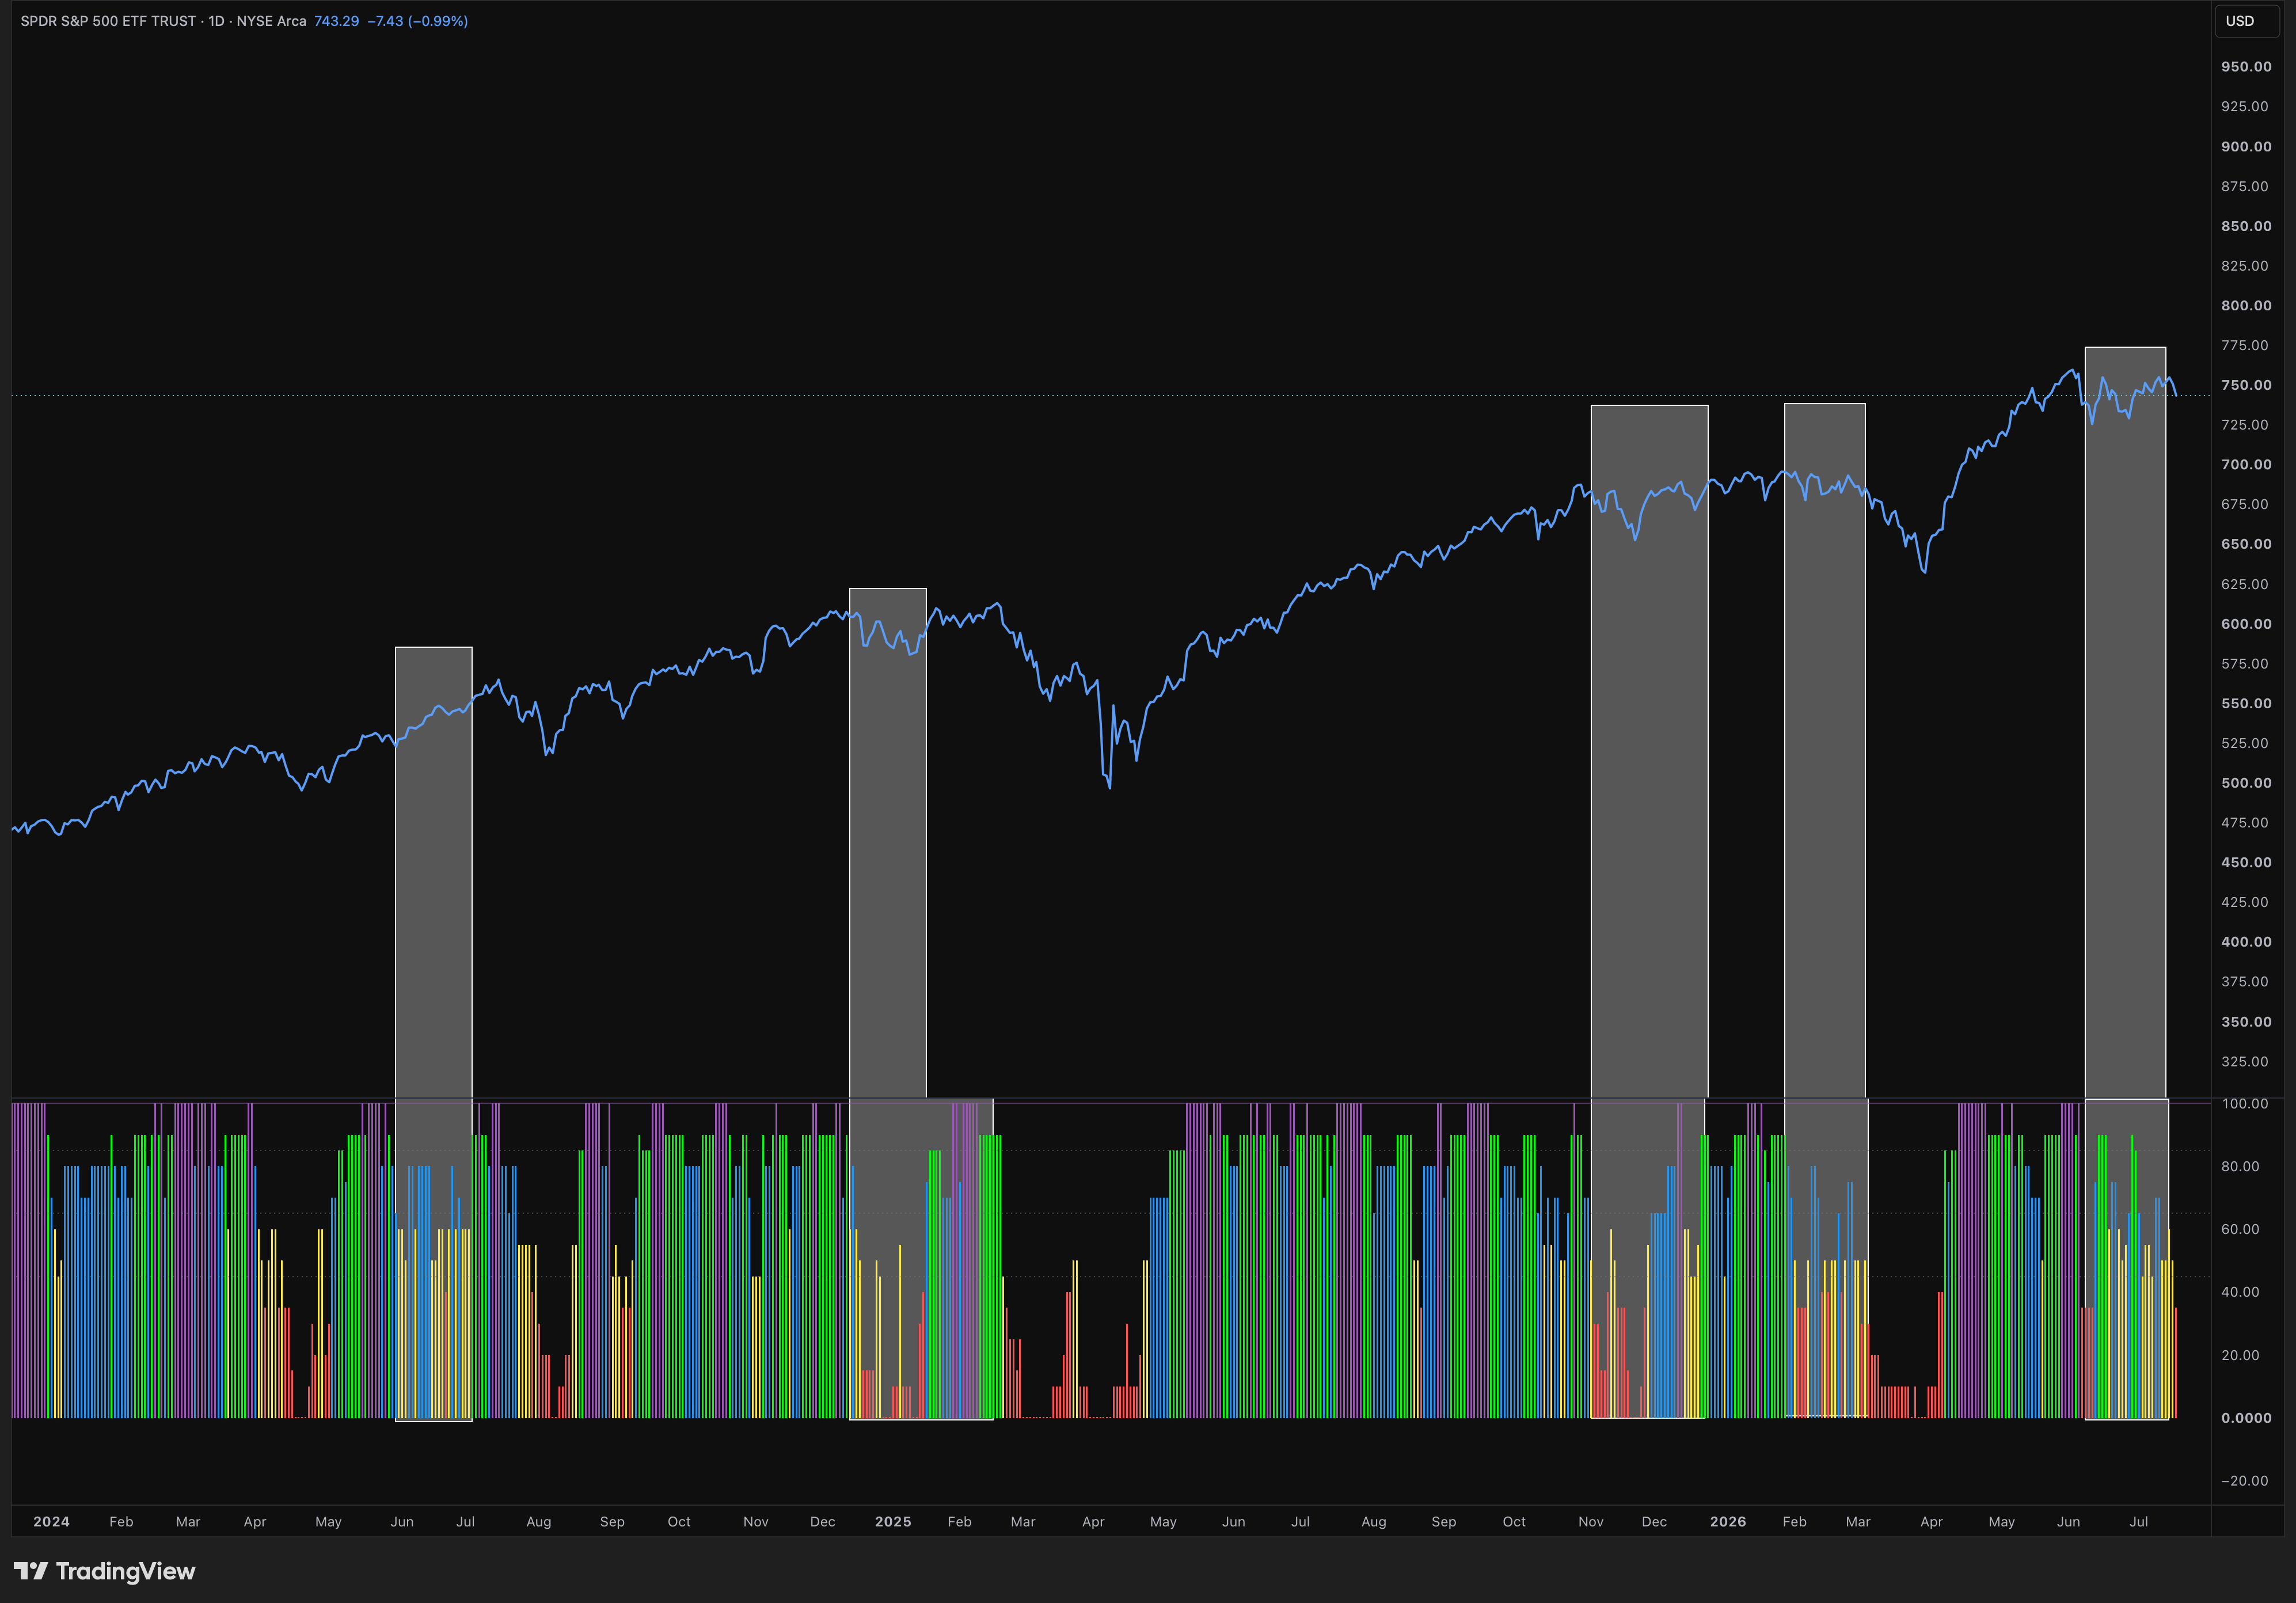
My market regime model has been mostly in caution lately and after Friday’s close it transitioned into a defensive regime.
I respect my model, it is backtested and it ensures I am aligned correctly. And when it is in caution or defensive, it is best to take it easy until we transition into an bullish regime.
At the same time if we get a washout score of zero for a couple of days, that is usually when we turn, but that would need a more aggressive decline to trigger.
High Beta Stocks With A Historic Decline
It is important to note that the pace and the magnitude of the unwind in high beta has been incredible.
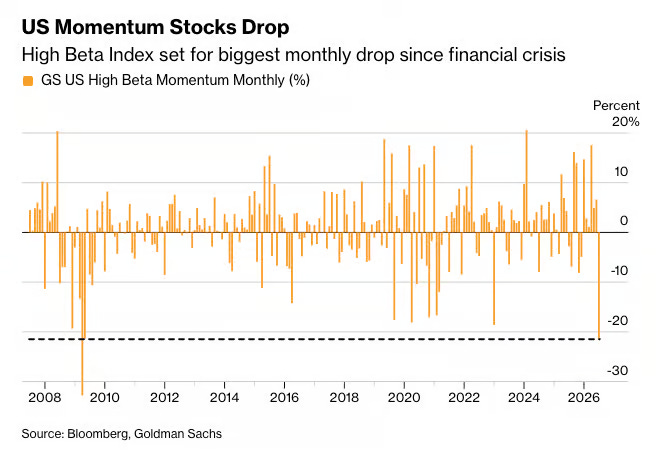
Largest drop in the Goldman Sachs high beta index since the financial crisis.
That is significant. Heavy leverage and crowded positioning will produce moves like these, froth has decreased significantly and getting rid of this excessive leverage and positioning is key for high beta to turn.
Still some work to do IMO, but damage has been done.
The Historical Path For Momentum Stocks
After sharp rallies and sharp dumps, historically we go down some more consolidate and turn.
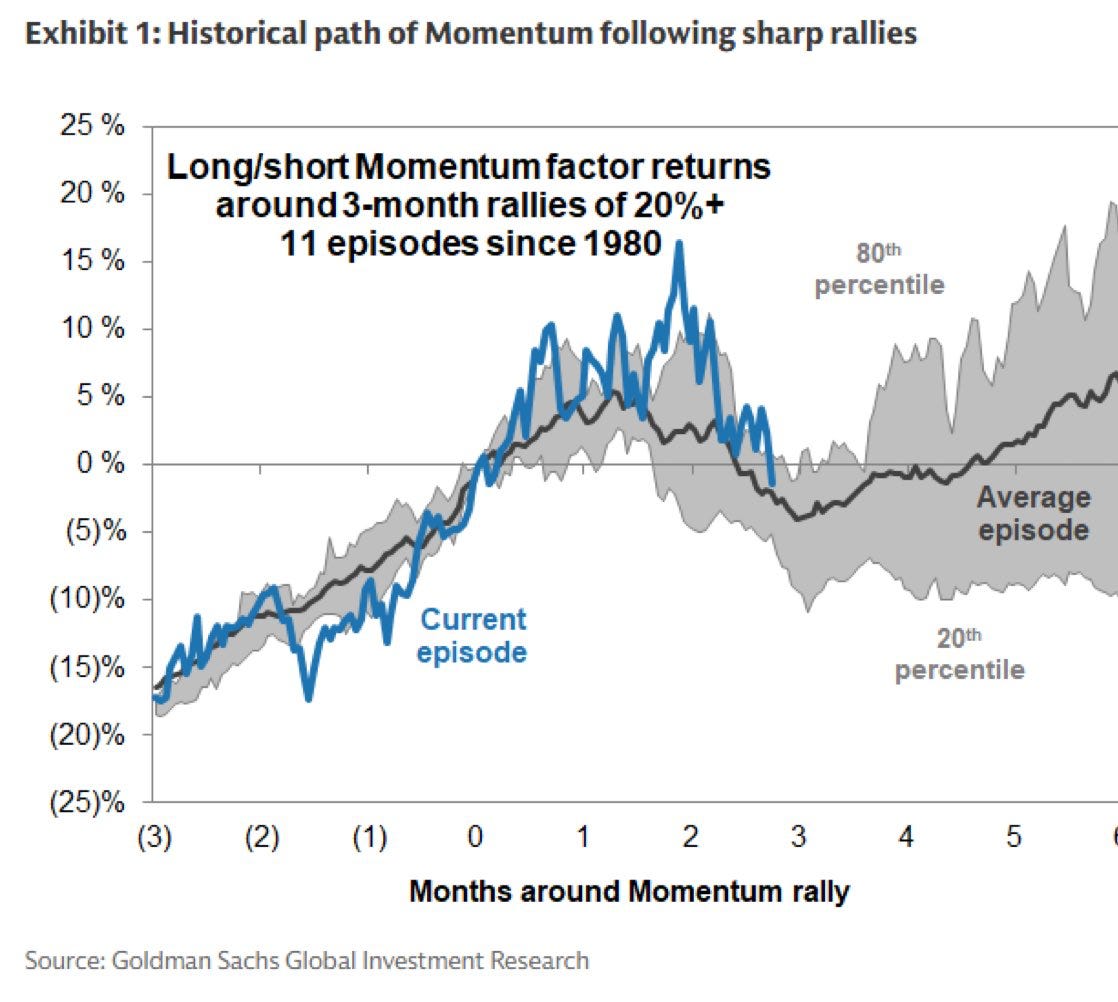
Not really a surprise, but if history repeats, the worst part of the decline is made. But there are some ugly outliers in this data to keep in mind.
Tech Needs To Bid For The Market To Go Anywhere
Rotation causes pauses, but we won’t make any meaningful advance in the market before tech bids.
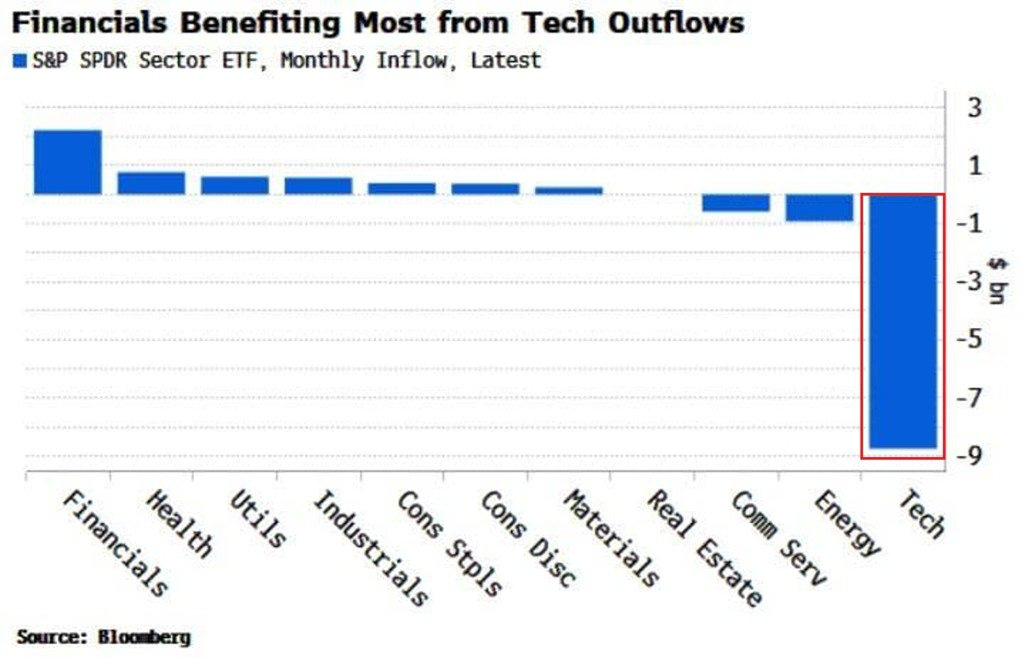
And step one for that to happen is heavy outflows — and we actually have that.
Because outflows from tech will lead to inflows later, it is removing excess positioning.
We do however still see inflows into the semis, so I wouldn’t be surprised for further chop and weakness in them from here.
MAGS Rotation Will Weaken Soon
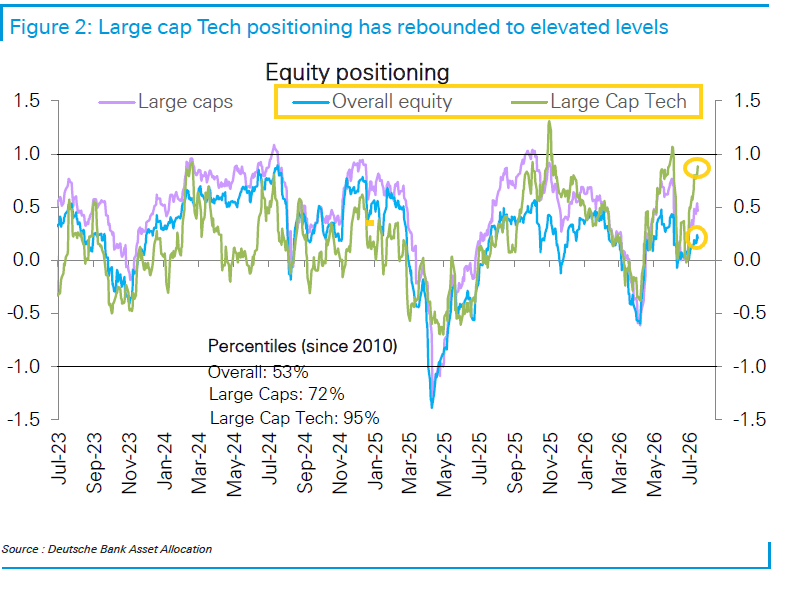
Large cap tech positioning is getting stretched fast.
Some Important Charts
Semis Are Still Fine
Looking at the bigger picture, there are layers of weakness.
Layer one is closing beneath the weekly 10 SMA — that’s where weakness starts, but structure often stays intact like now.
Layer two is losing the weekly EMA 21 — that is yet to happen.
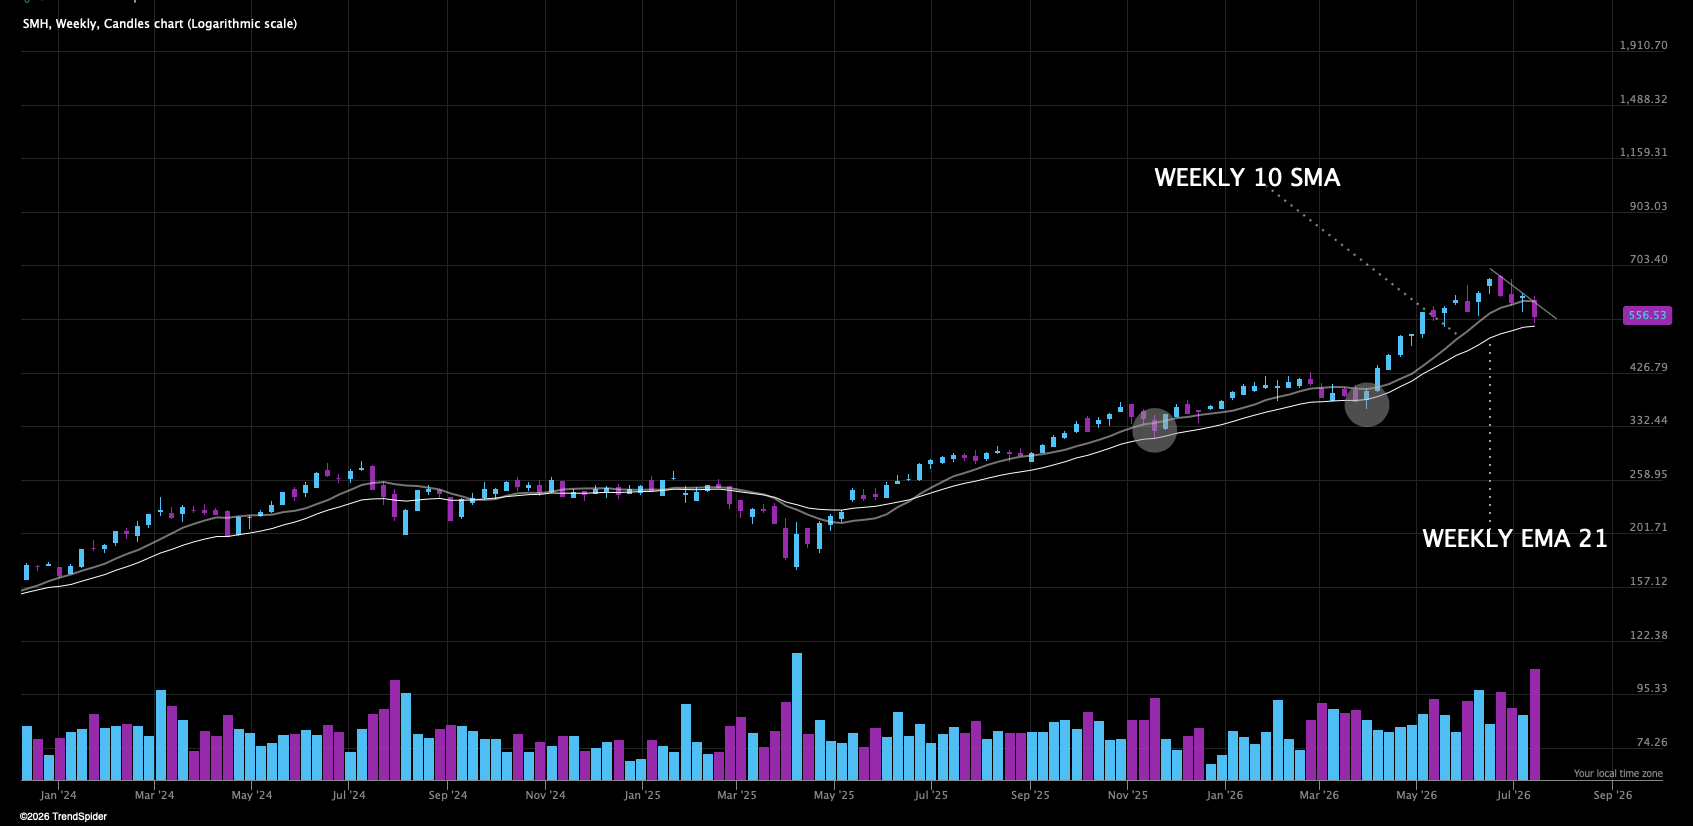
And the weekly EMA 21 has been respected on prior declines. I can’t be too bearish yet, I see a necessary decline after a huge move. However it is not uncommon for some chop and sideways here for weeks or more.
But still too early to call death on the semis.
Zoom out.
But we still see small and midcap semis underperforming the large caps, which is a sign risk on in semis is not here yet.
Key Support For XLK
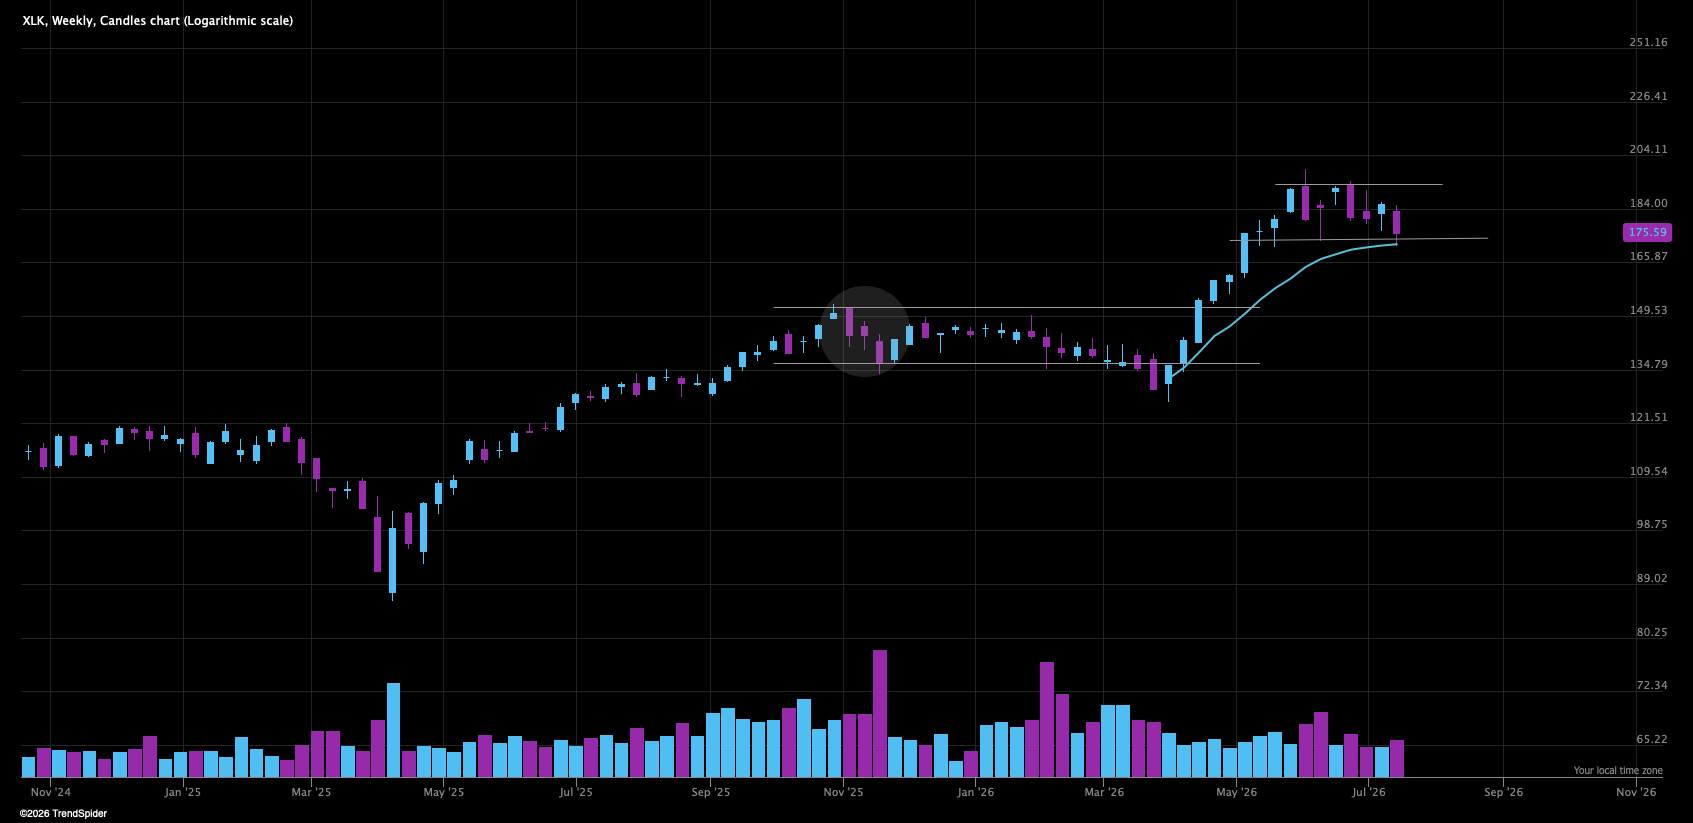
Found support at this significant AVWAP, if it holds tech should be able to squeeze higher. But bigger picture still rangebound.
Cybersecurity Is Interesting
Last week I said it looks like a test down is coming. Well they trended higher but still look like a test down is coming.
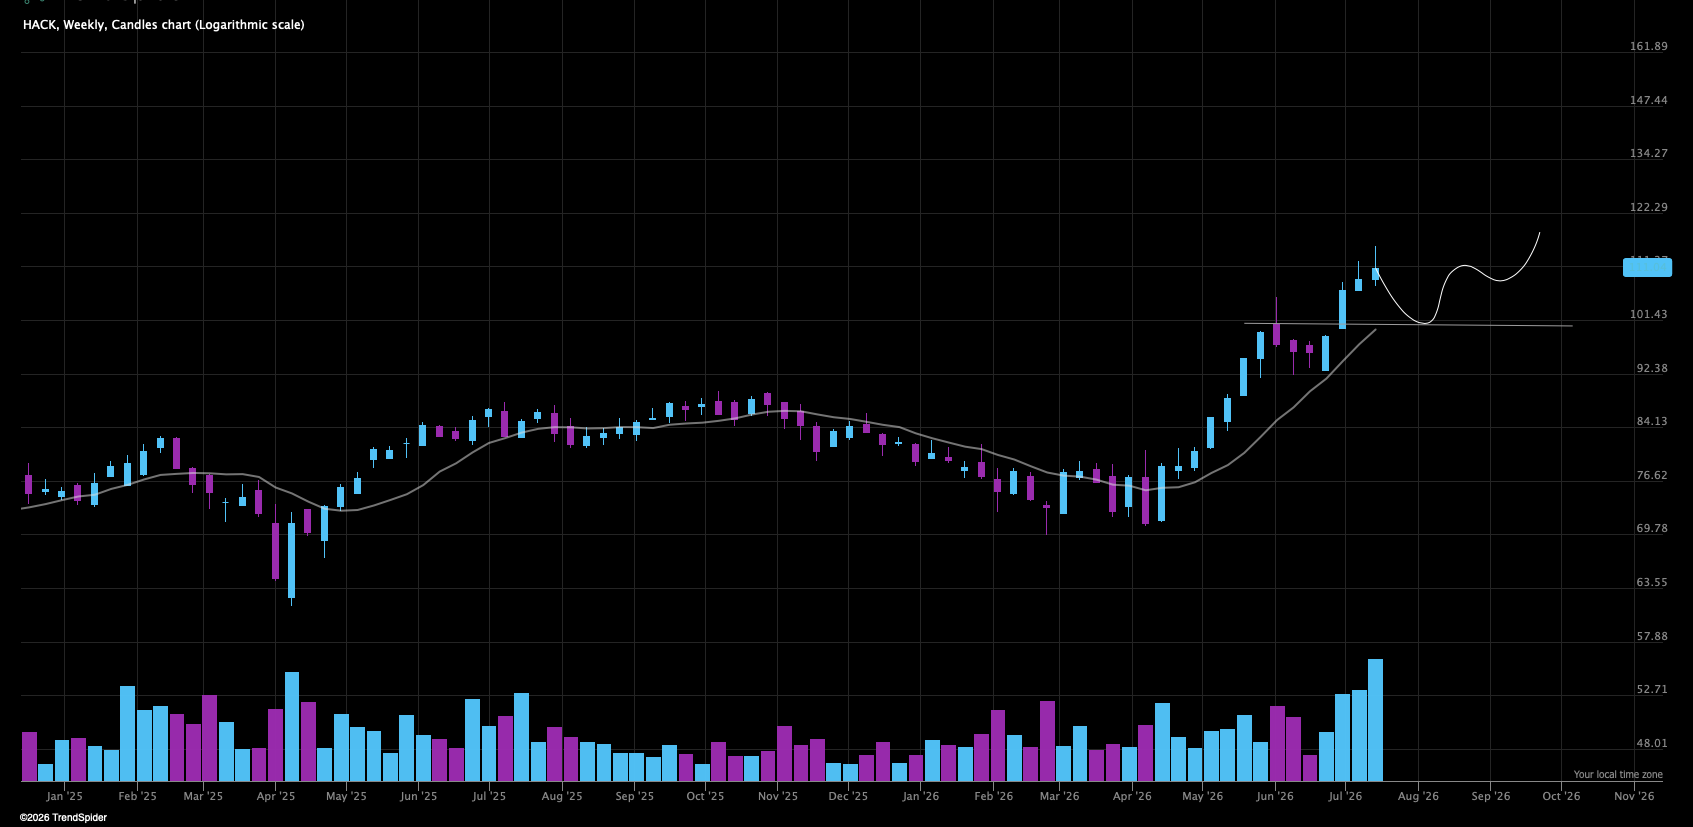
And leadership is best assessed on pullbacks. If cybersecurity can act constructive on a decline while the overall market is weak, it might be a sector to really focus on.
However I still think it’s prudent to show you this.
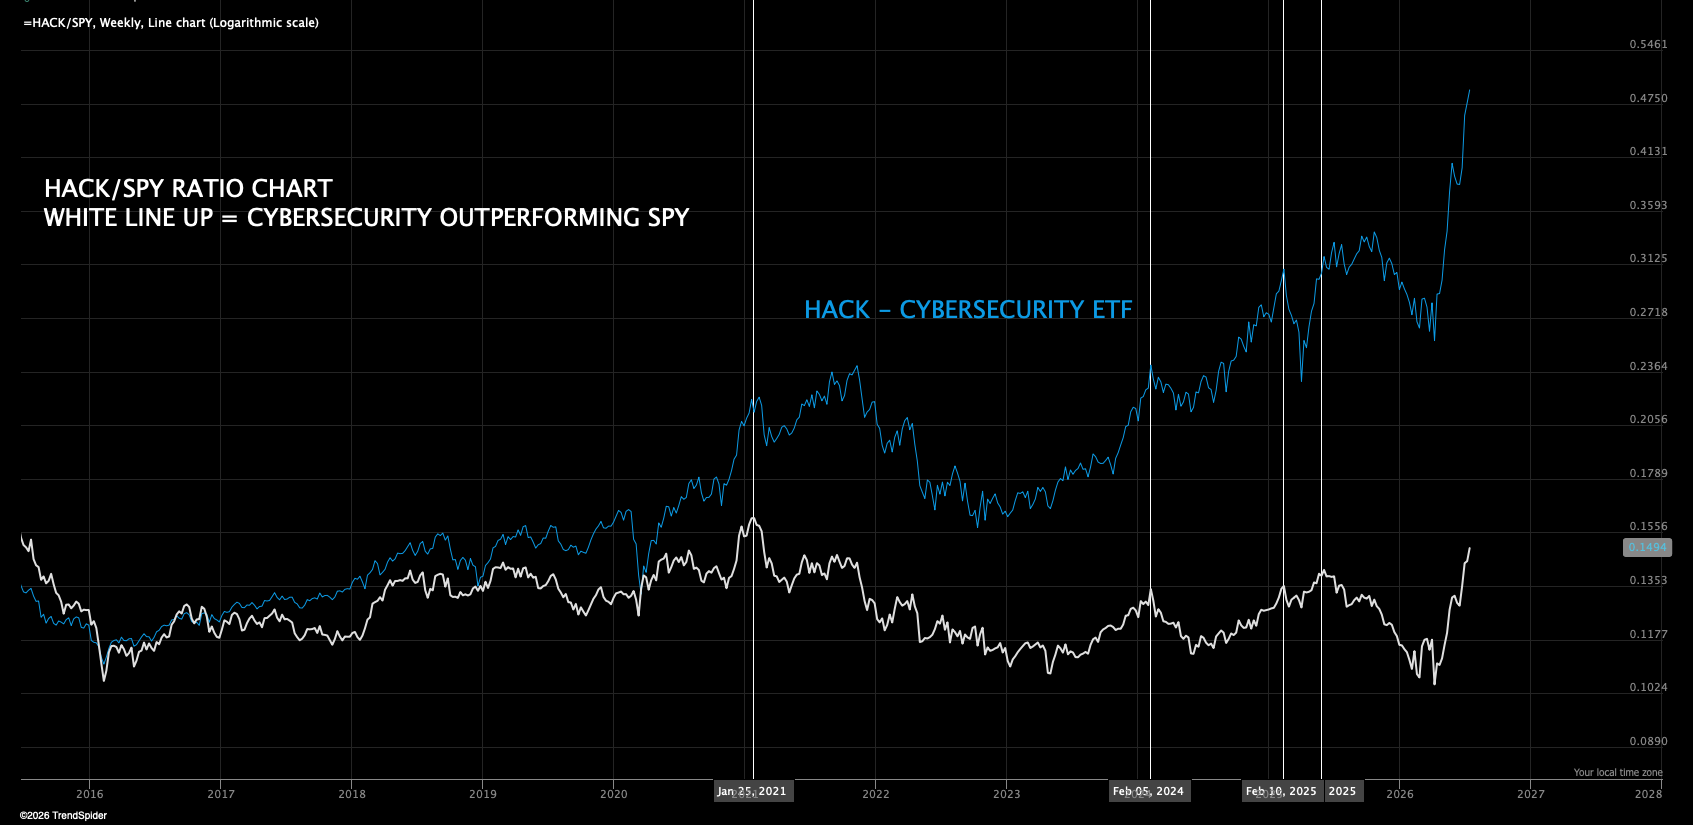
Looking back, whenever cybersecurity outperforms the market like this, cybersecurity often tops. Maybe this time is different, but maybe something to keep in mind.
Software — XSW
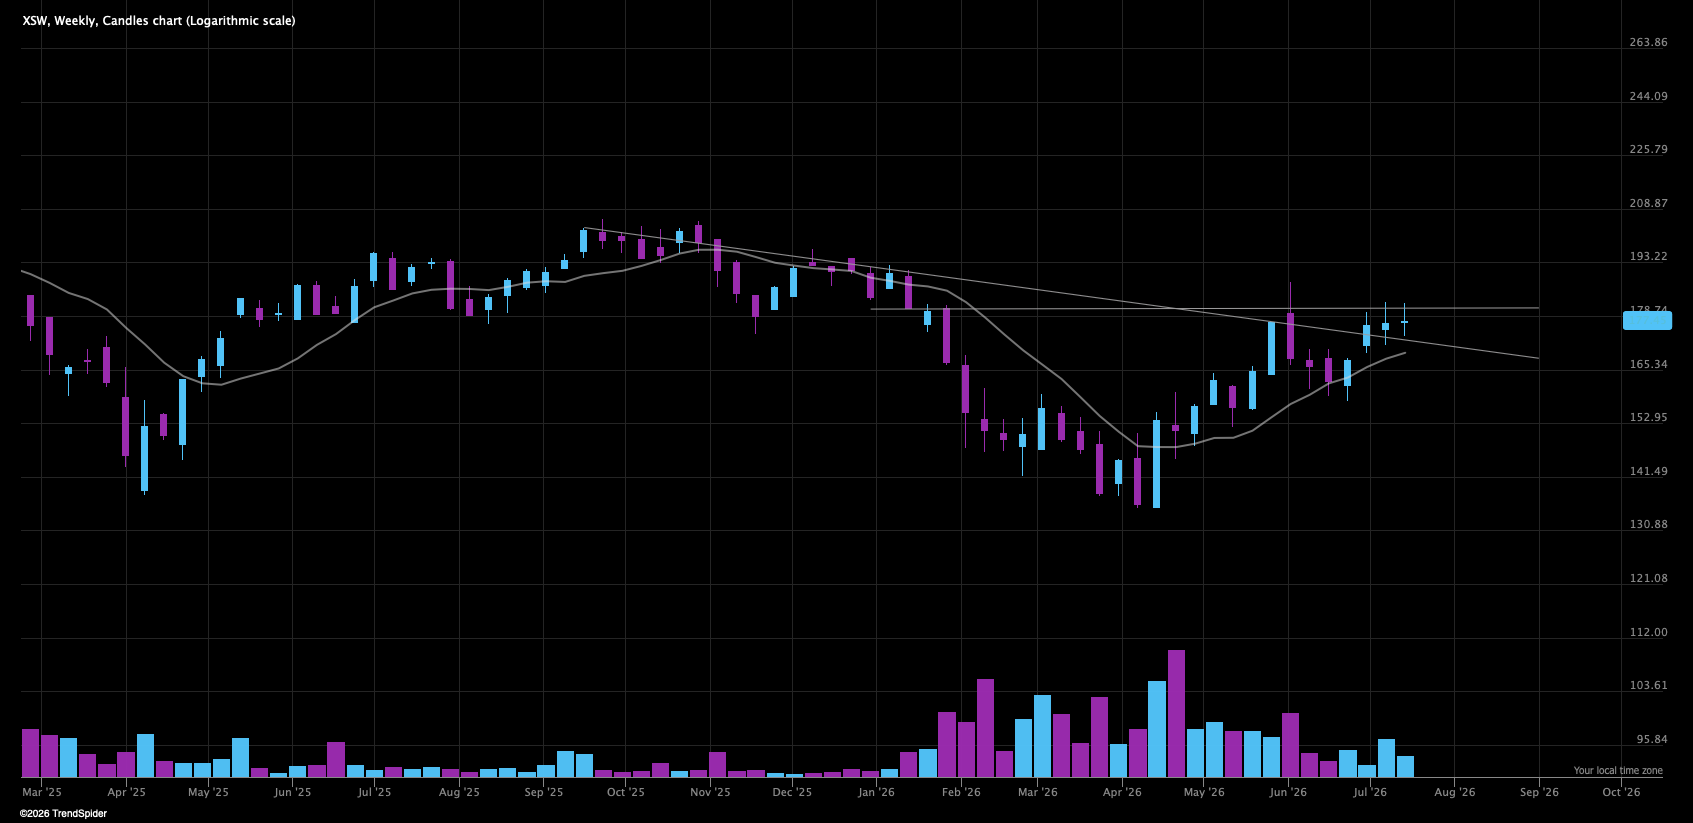
Looks very constructive to me, maybe a last shakeout before take off? One of the top sectors I am focused on currently.
ARKK Rangebound
Broke down from the wedge like we thought would happen last week. But still at key support.
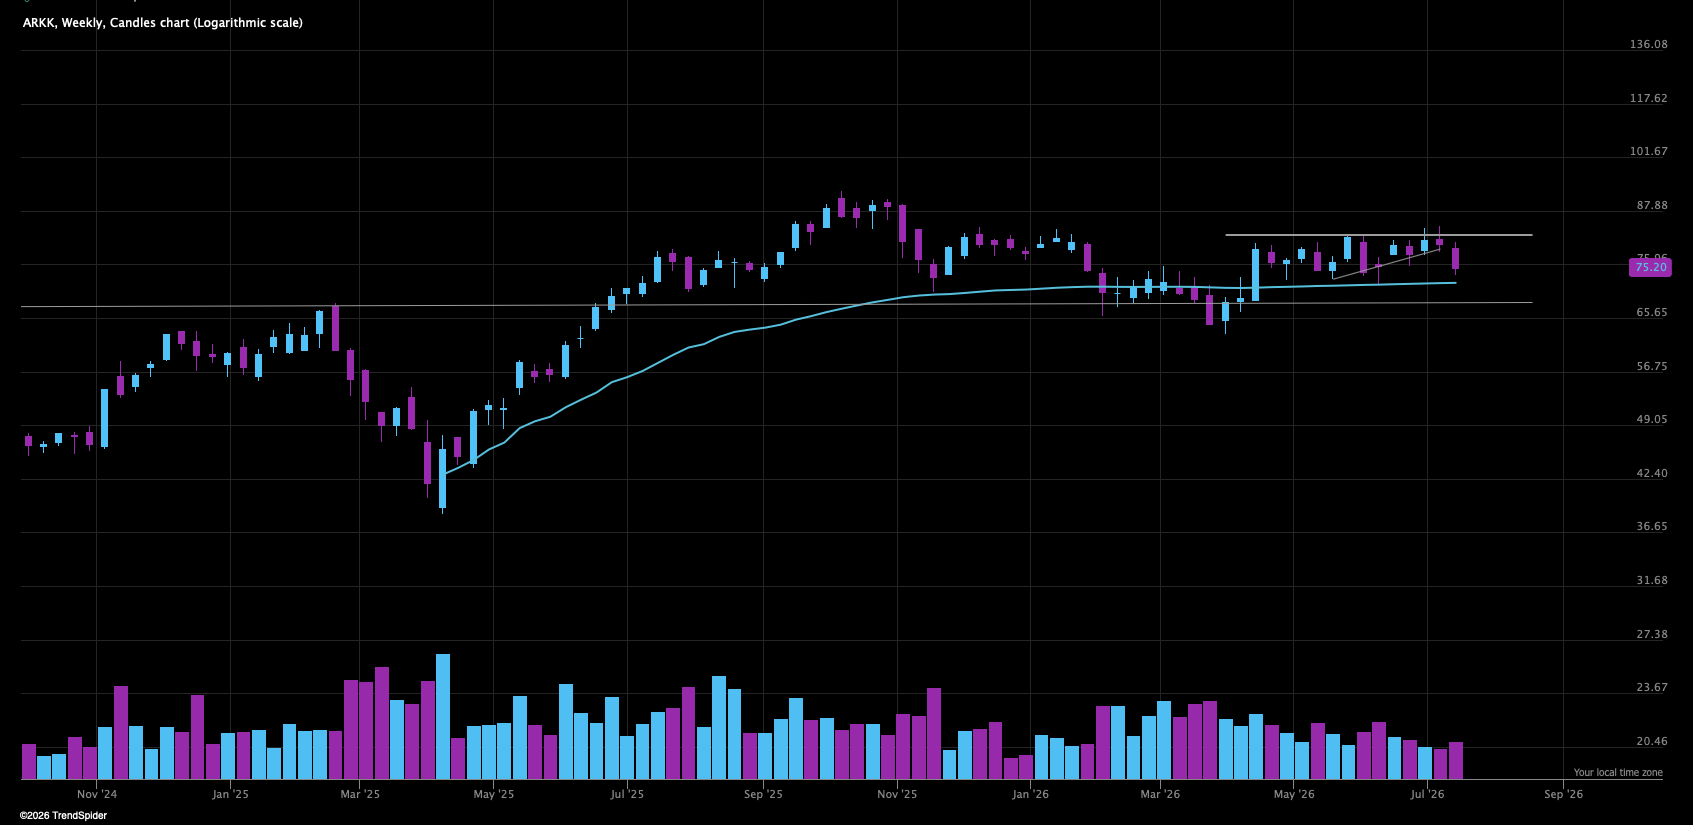
But to me looks like ARKK is about to roll over in a more significant way soon.
Bitcoin Turning?
Continues to respect the double bottom we have mapped out for weeks.
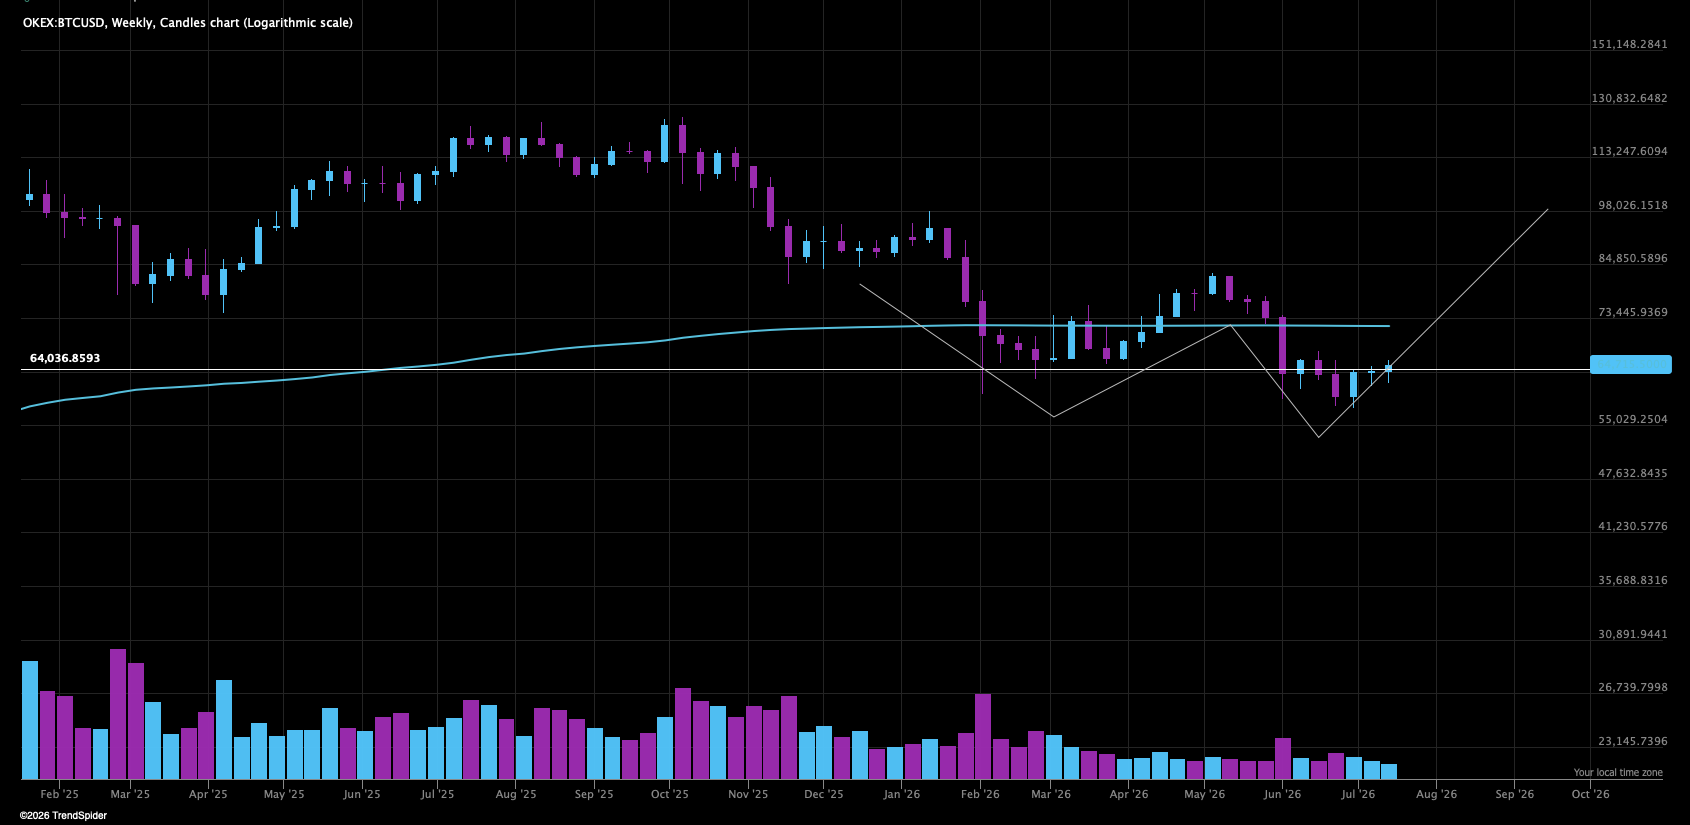
Maybe, but still early.
Gold Still Stuck
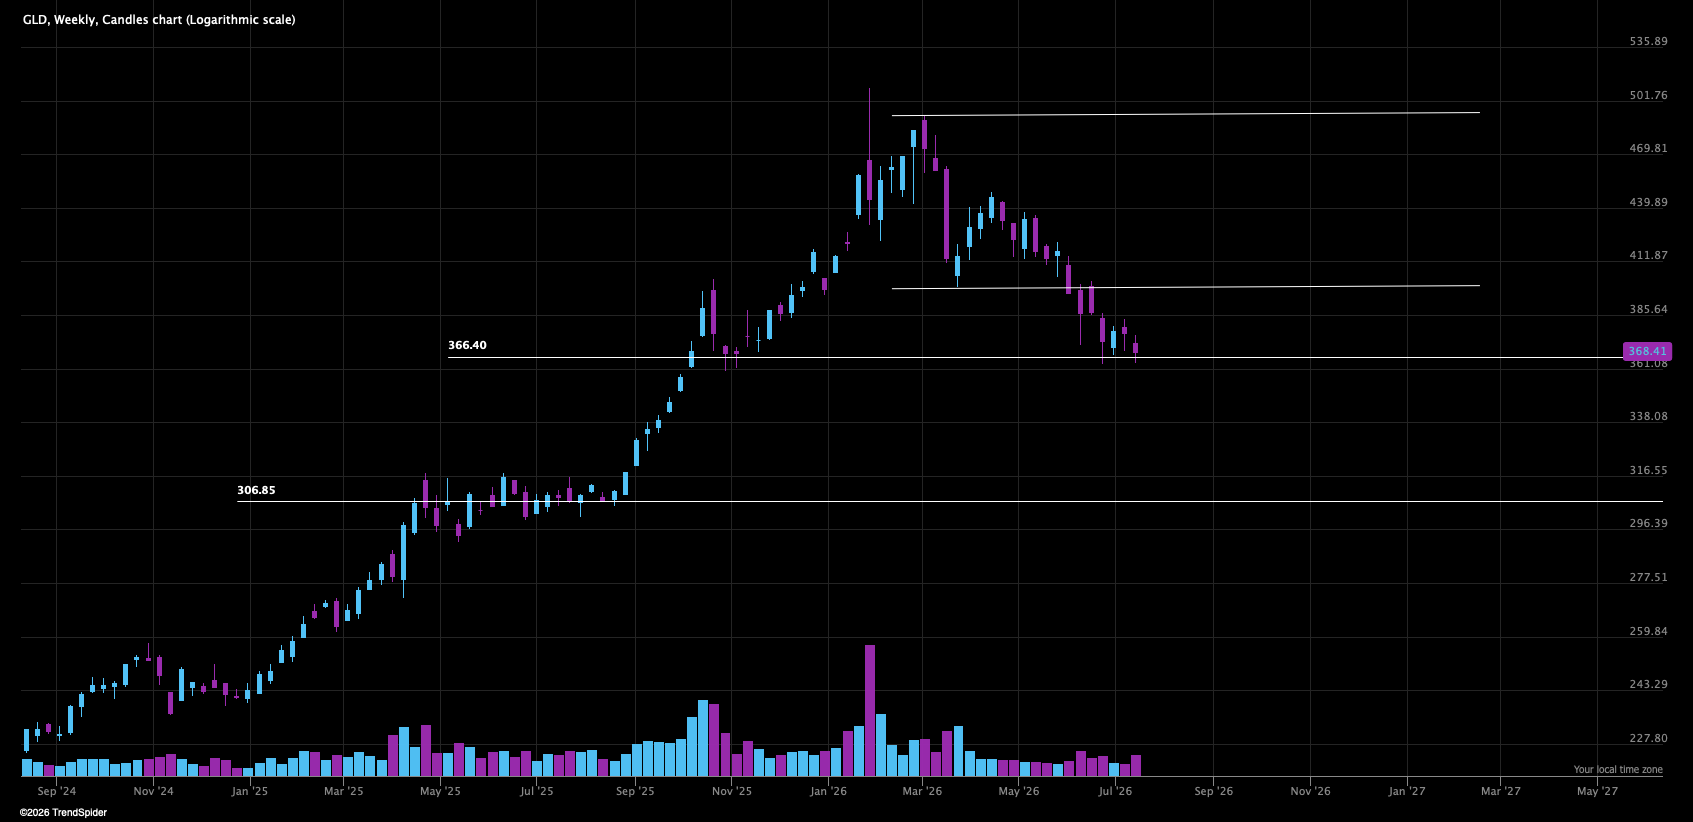
Holding where it should but needs to bounce.
Healthcare Interesting — XLV
One of the more interesting sectors outside of tech currently.
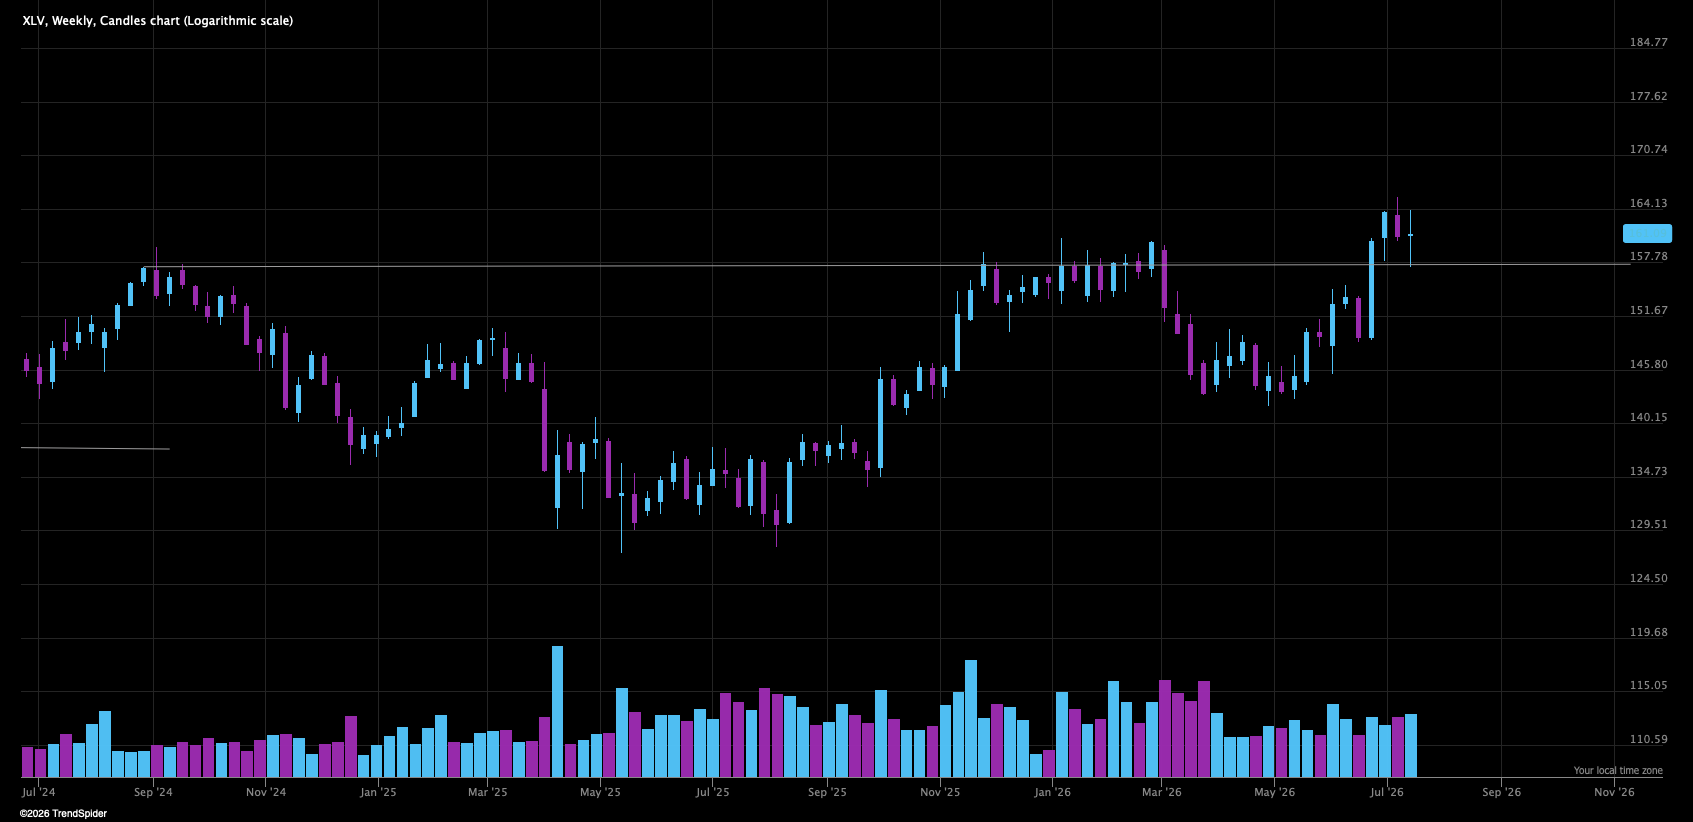
Three week consolidation above the breakout level of a huge base is interesting.
Energy Breaking Out
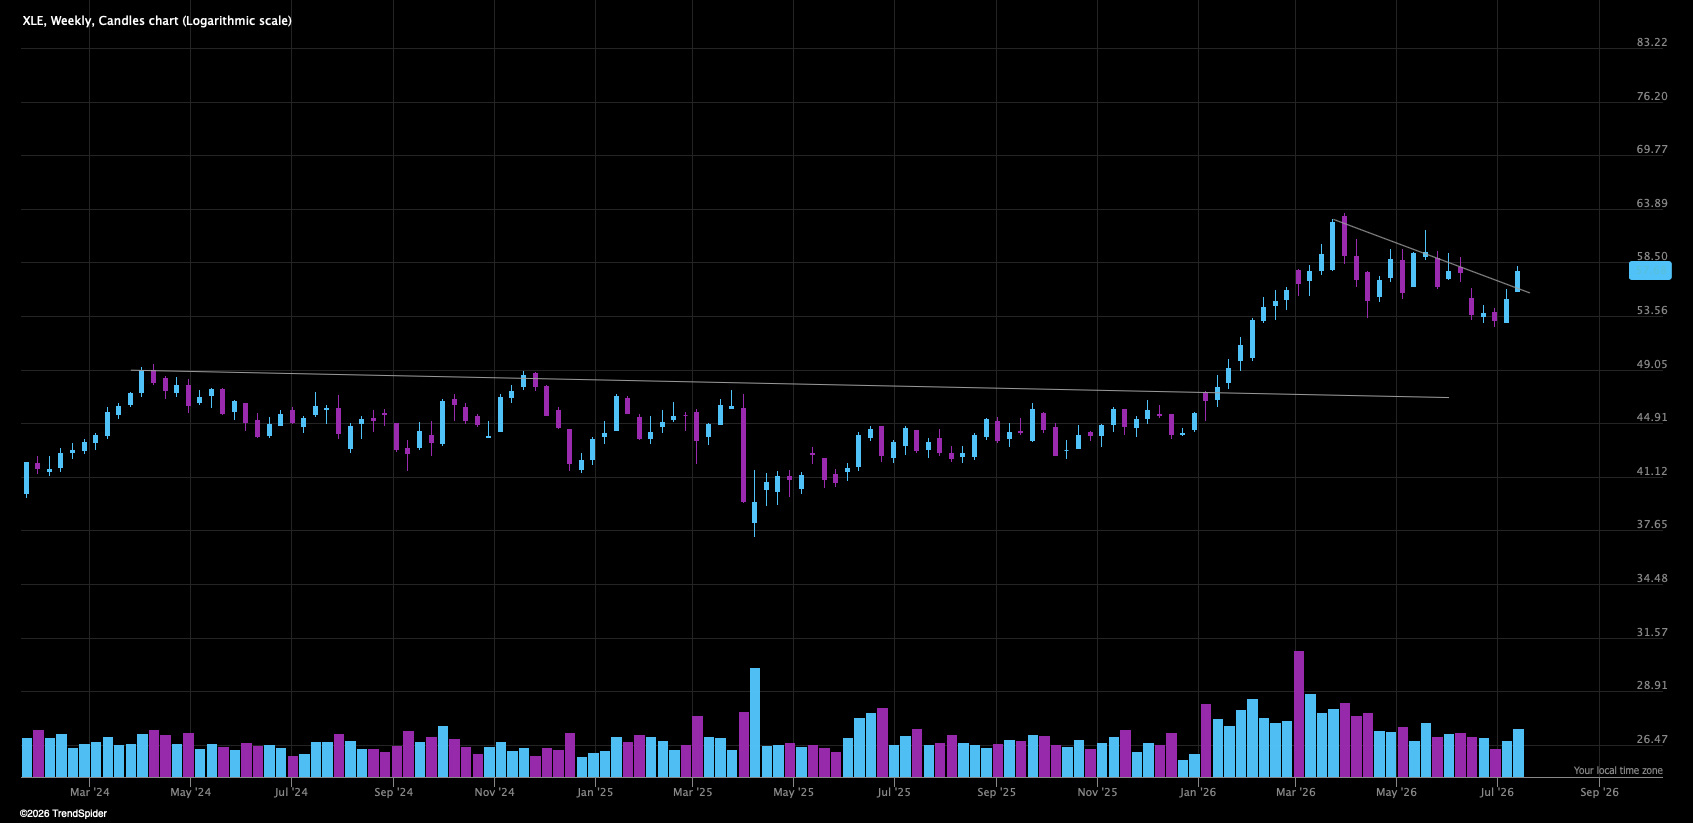
From a large multi month consolidation after it’s first move. Interesting.
It Might Be Time For Clean Energy — PBW
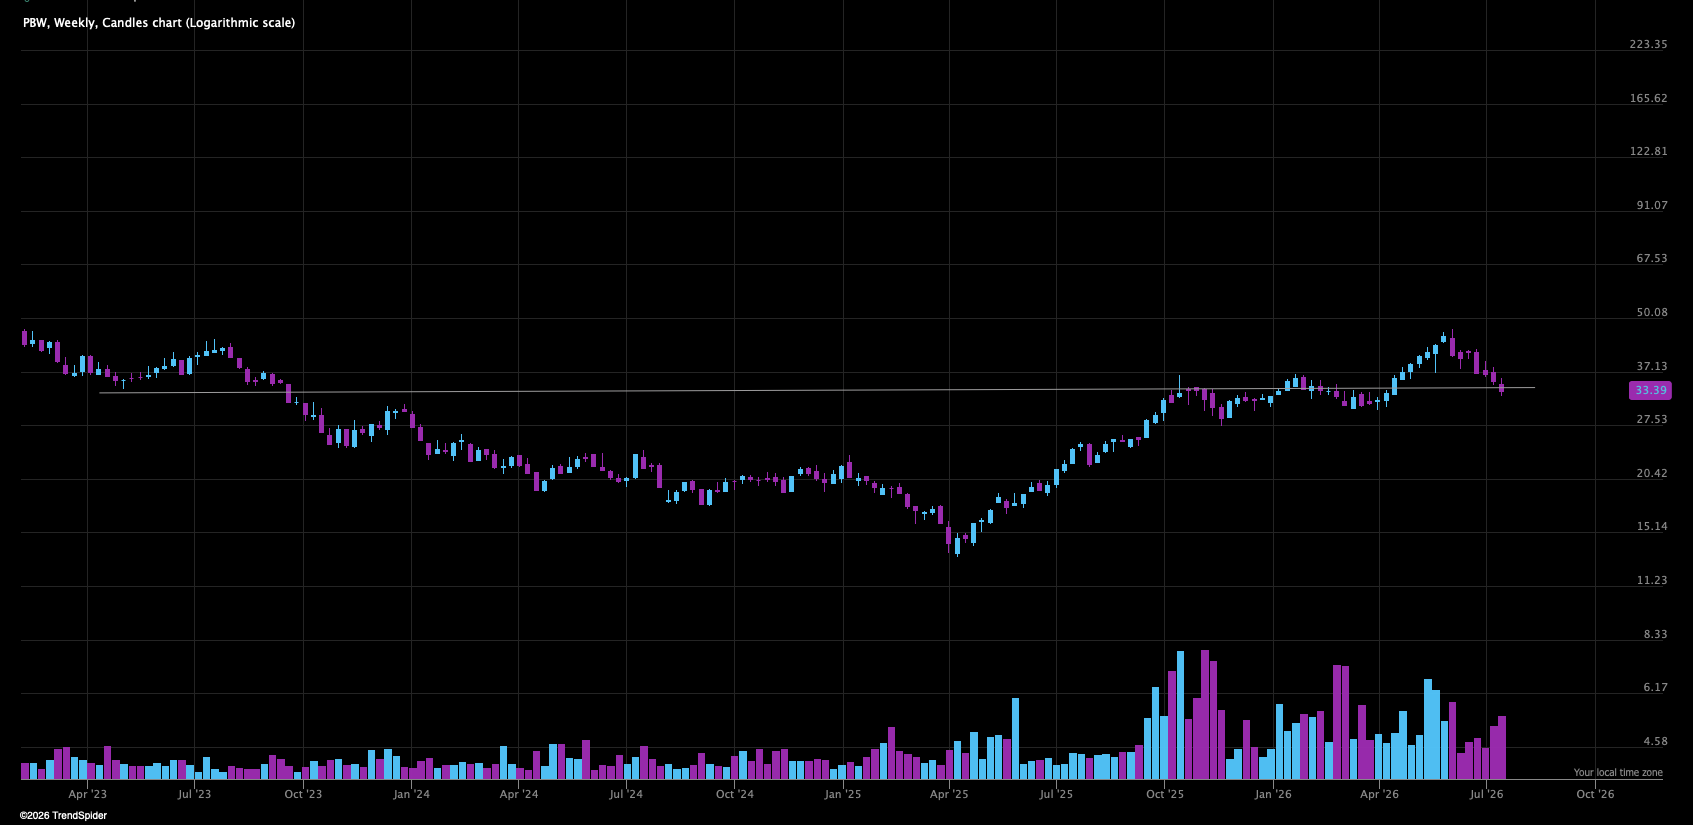
Extreme weakness lately, but backtesting this huge base and at key support. But needs to turn and build for a couple of weeks, but an interesting sector to monitor.
Lastly DRAM
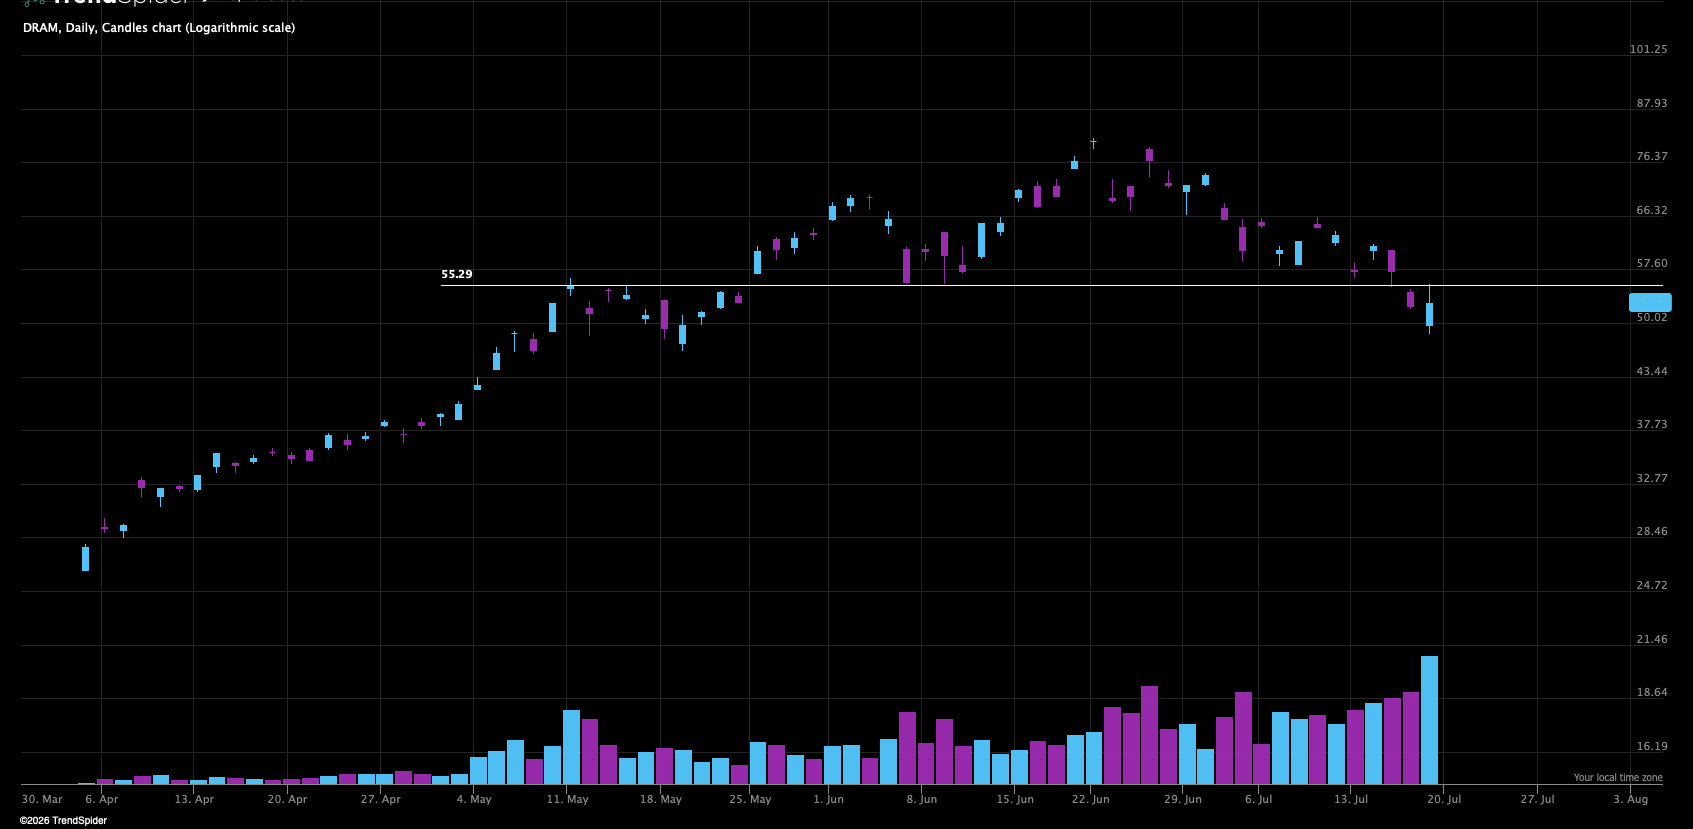
HVE in the ETF just under a critical pivot. Needs a reclaim soon to save itself short term.
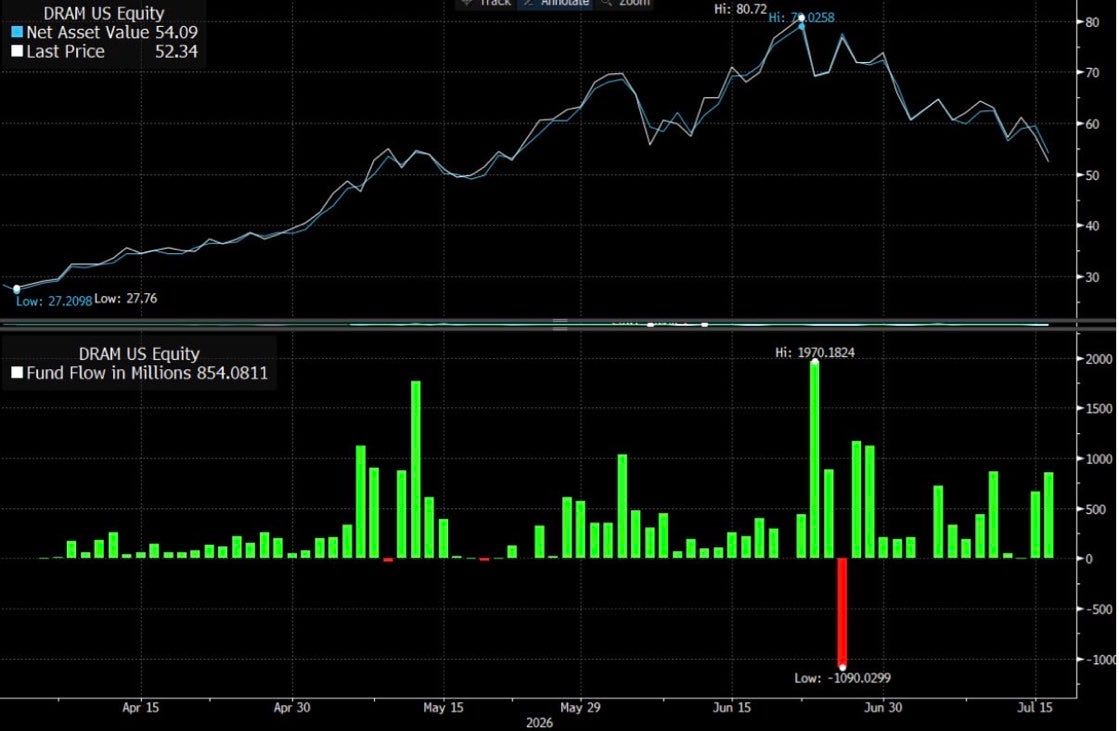
But just like the semis we are still seeing net inflows into DRAM, no capitulation present. Often favors more chop at least.
The Bottomline
The market lost key support end of last week, however bigger picture structure is intact and in favor of the bulls.
I think it’s very easy to become too bearish here, I think a bounce in tech is around the corner and the most likely scenario is continued chop after that
However we are at a delicate spot and swift declines can occur when we are below all short and intermediate term significant moving averages like now — I am very cautious here until we see some bullish clues
The broader market is fine, the million dollar question is if they will keep being fine or if weakness will creep into other sectors as well soon — to be decided
Setups are a trader’s best friends, because they are our gates to enter the market — when setups are very few like now, we have no way of entering and thus sit on our hands and wait for conditions to improve
This is not the time to push for me but I will say that I am watching the prior leaders very closely, because this is the time to watch them when everyone else moves on. True market leaders seldom die easily and most test the 50 SMA several times a year. When semis start bidding again, I believe the market will likely bottom and improve — they are still the leaders until they crash and burn.
A day by day market where less is more and study of RS is more important than executing upon it.
Patience is key here.
I want to continue develop TSF - Analytics and this service, to make it the best platform available for our type of trading.
To do that I need to grow, every like and every restack does wonders. Without the engagement of the community — there is no growth because visibility from the algos disappears.
If you appreciate what I do, feel free to share, restack or tell some friends —it is the only way for me to grow.
Charts courtesy of SentimenTrader.com
https://sentimentrader.com/subscribe-newsletter
Charts courtesy ofwww.menthorq.com
Charts courtesy of TradingView
Charts courtesy of TrendSpider
Disclaimer:The Setup Factory and The Setup Factory Analytics are not registered investment advisors, broker-dealers, or financial planners, and are not licensed to provide investment, legal, or tax advice in any jurisdiction. All content provided through The Setup Factory Substack publication, The Setup Factory Analytics platform, and any associated communications reflects personal opinions, observations, or analytical interpretations and is provided for educational and informational purposes only.
Nothing contained herein should be construed as investment advice, a recommendation, solicitation, or offer to buy or sell any securities, financial instruments, or assets. Any analysis, data, tools, indicators, dashboards, or models provided by The Setup Factory Analytics are intended solely to support independent research and decision-making and do not constitute personalized investment advice.
Investing and trading in financial markets involves substantial risk, including the possible loss of some or all of your invested capital. Past performance is not indicative of future results. You are solely responsible for your investment decisions and for evaluating the merits and risks associated with any investment.
You should conduct your own independent research and due diligence and consult with a qualified, licensed financial advisor or other professional before making any investment decisions. By accessing or using this content or platform, you acknowledge and agree that The Setup Factory and The Setup Factory Analytics shall not be held liable for any losses, damages, or decisions arising directly or indirectly from the use of the information provided
Thanks as always, and good luck out there, everyone!