


Shortest Bear Market In History Or An Overly Obvious Bulltrap?

This post is long containing many charts. Your e-mail might cut out a part of it. To ensure you can read the whole post, read it through the substack app
One Week Felt Like An Eternity
So much has happened in the past week, the most intense financial week since COVID. Instead of looking back, we are going to focus on looking forward. Today we will breakdown:
Where we stand and my main scenarios going forward
Sentiment and breadth observations that can lead us to understand the coming direction
Smart money, big commercial hedgers and retail positioning patterns
VIX
Trade plan and recommendation on how to act the coming week
Add a stock to the focus list located at buy point - A true High Tight Flag, in this environment, which is insane
Our Focus Stocks From Last Week Are Leading The Market
Very bullish action across the board in our recent setups. But will it stick into next week?

Further down in todays post - we will add one name that have rallied 100% in three weeks and pulled back only 15%, producing a true high tight flag. While the rest of the market has seen the fires of hell.
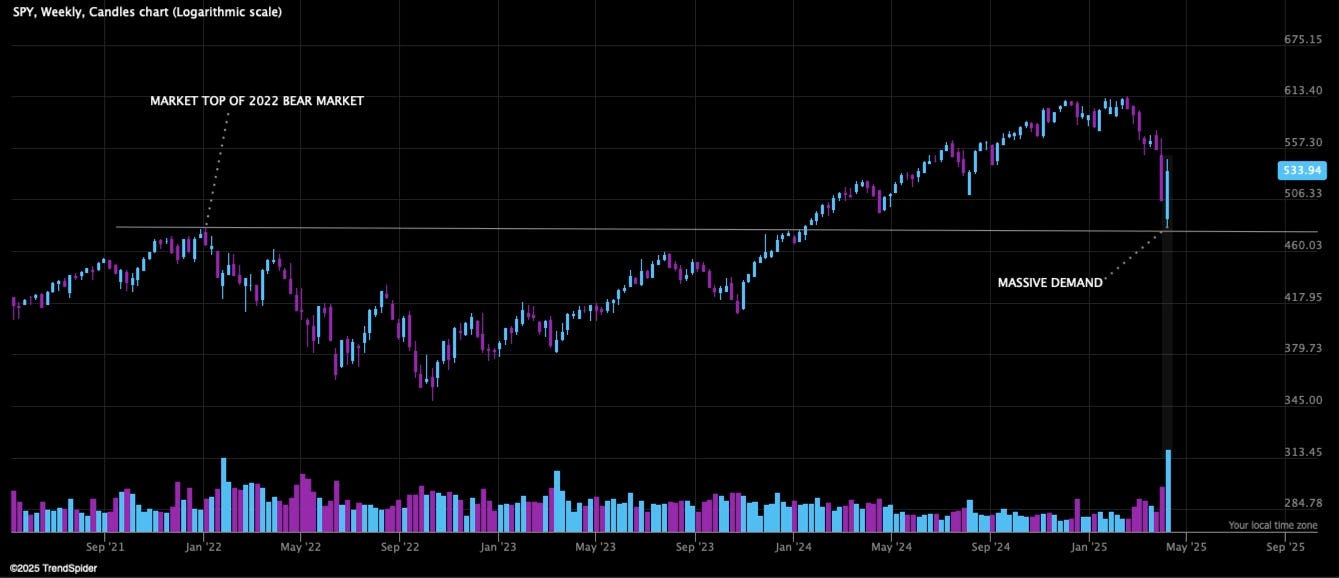
My Main Scenario In Last Weeks Market Analysis - Was Testing The Market Top Of The 2022 Bear Market

You Can Be As Bearish As You Want
But that is one magnificent weekly reversal candle on insane volume - from a logical support. That is a first bullish sign - there is no denying it. Quality demand came in. But will quality demand followthrough and produce a trend reversal immediately? That is a whole other game. In a high volatility environment like this, there is so much noise.
It is better to zoom out and look at the big picture with fresh eyes
But I Also Like To Zoom In
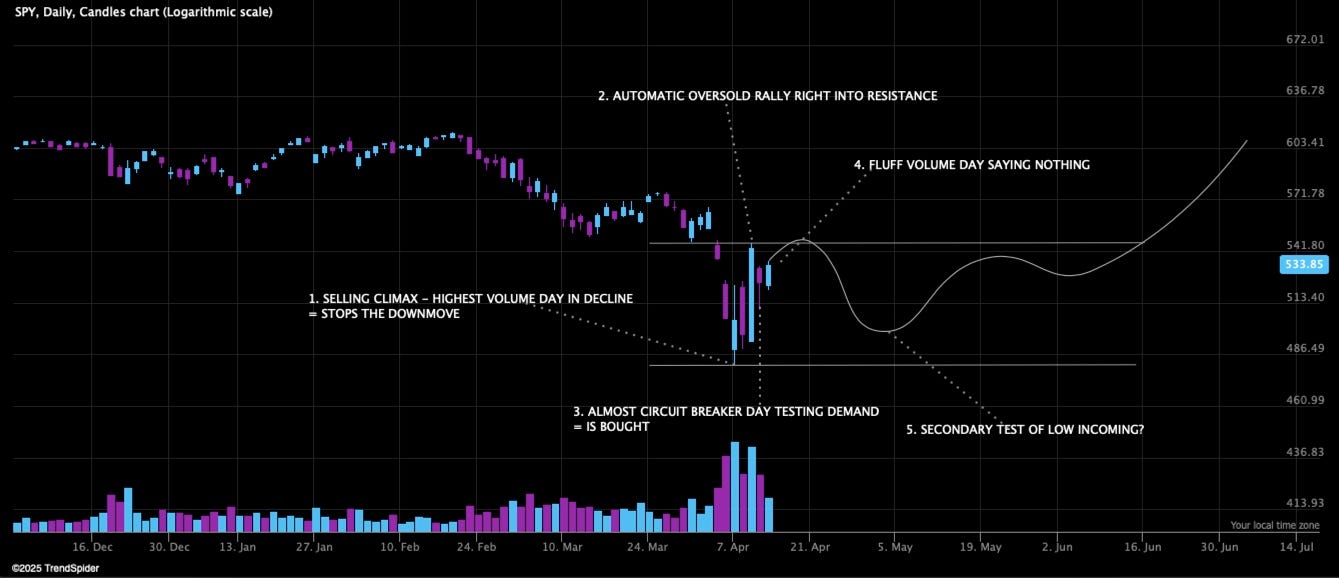
So we got a selling climax with a massive bullish reversal - great
After that we almost got a circuit breaker day - testing the low again which was bought. Also good, but the selling pressure was very aggressive
And yesterday we got a fluffy low volume up day - saying nothing
Don’t Forget How Oversold We Actually Were Before We Turned
It is great that we got a good bullish weekly close from the selling climax. But still, don’t over interpret reactions from extreme oversold conditions. Moving averages are a great way to objectify oversold conditions and exclude the noise.
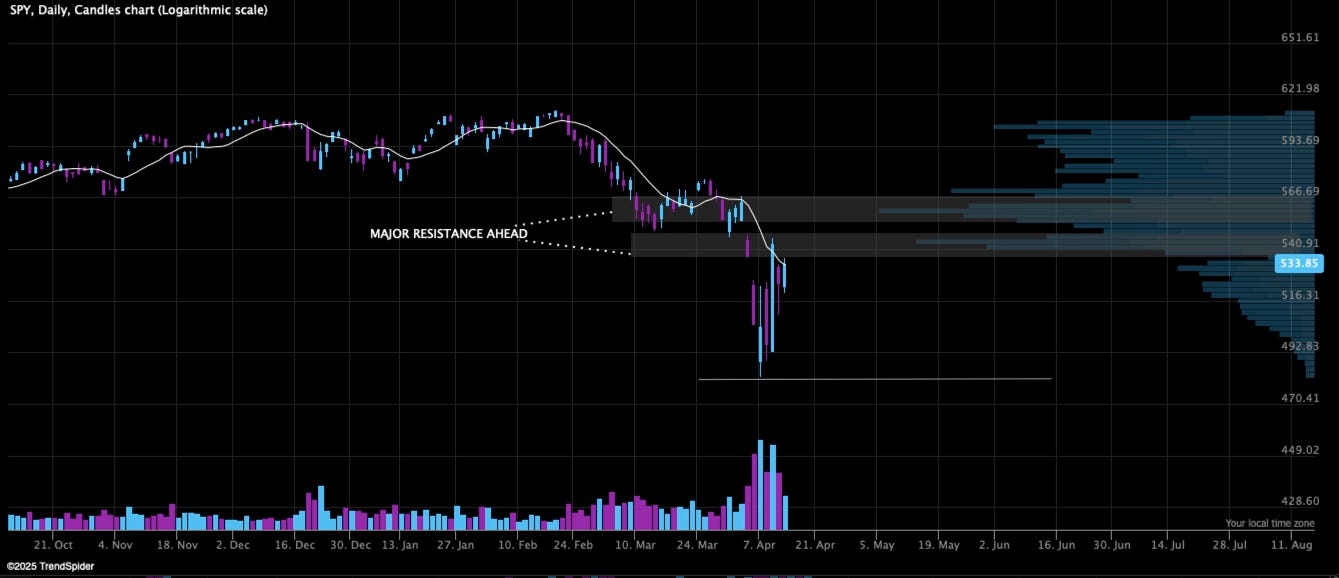
This Is Were The Rubber Meets The Road
The easy stride is behind us. We are rallying from an extreme oversold condition, right into major resistance. Above you also see the 10 day moving average. During our previous decline, price managed to establish above it.
Price is now testing the 10 day moving average. If we can’t pierce through this now, this would be a significant sign of weakness. However, sometimes price needs to test moving averages a couple of times, before mustering the power to pierce through.
Which Leads Me To My Main Scenario
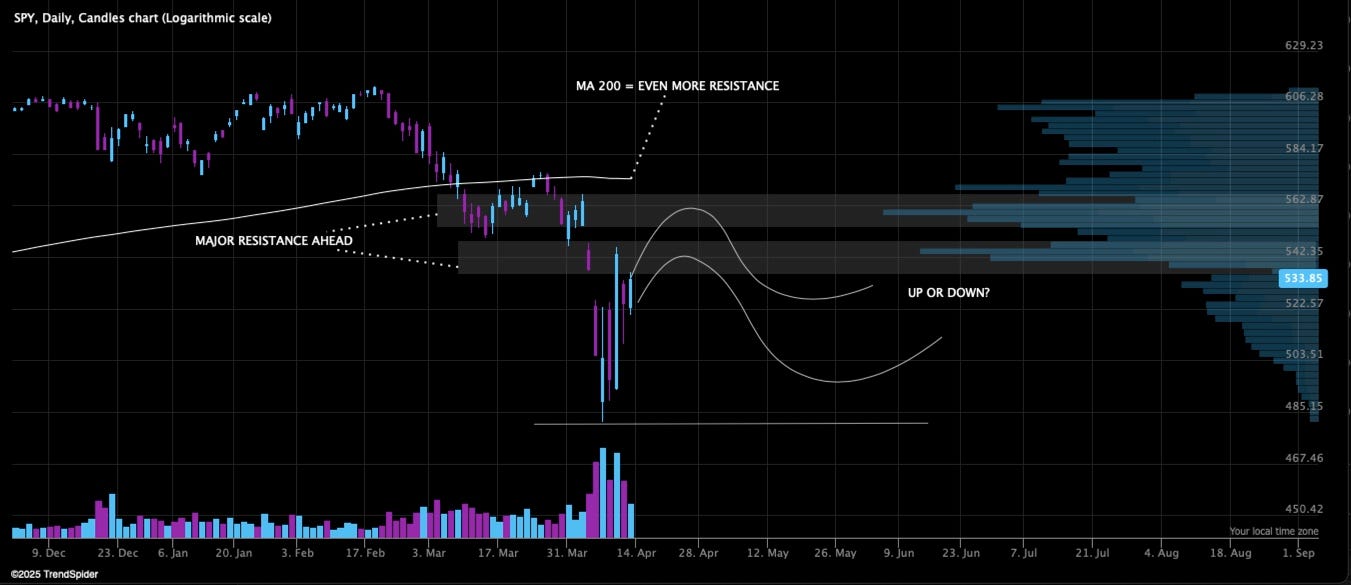
I am not sure what the longterm trend will be - Nobody can predict the future. Instead we will have to react to what is actually happening.
But I do believe that price will struggle at or just above these major resistance levels.
I believe that, because the character of the decline was so aggressive - price will need to test the lows again. To ensure that the supply is exhausted
This doesn’t mean we have to retrace the whole way down, but a test of of the supply near the lows is probable in the coming weeks
I Am Not Bullish Nor Bearish
And you shouldn’t be. You should be suspicious. But this doesn’t mean that we must stay in cash forever. There are a lot of very bullish setups at the moment which is a good sign. Even If we are heading down from here, doesn’t mean that individual leading stocks will.
I hope we get a decline or go sideways in the major indices next week, so we can study if the leading stocks are acting constructively. That can be a great entry point if this is the turn.
Also, most leading stocks we are monitoring, visually looks like they need a pause to develop some tightness. But sometimes they just melt-up or down instead - But I don’t chase stocks in bad market conditions, it is a great recipe for ugly reversals.
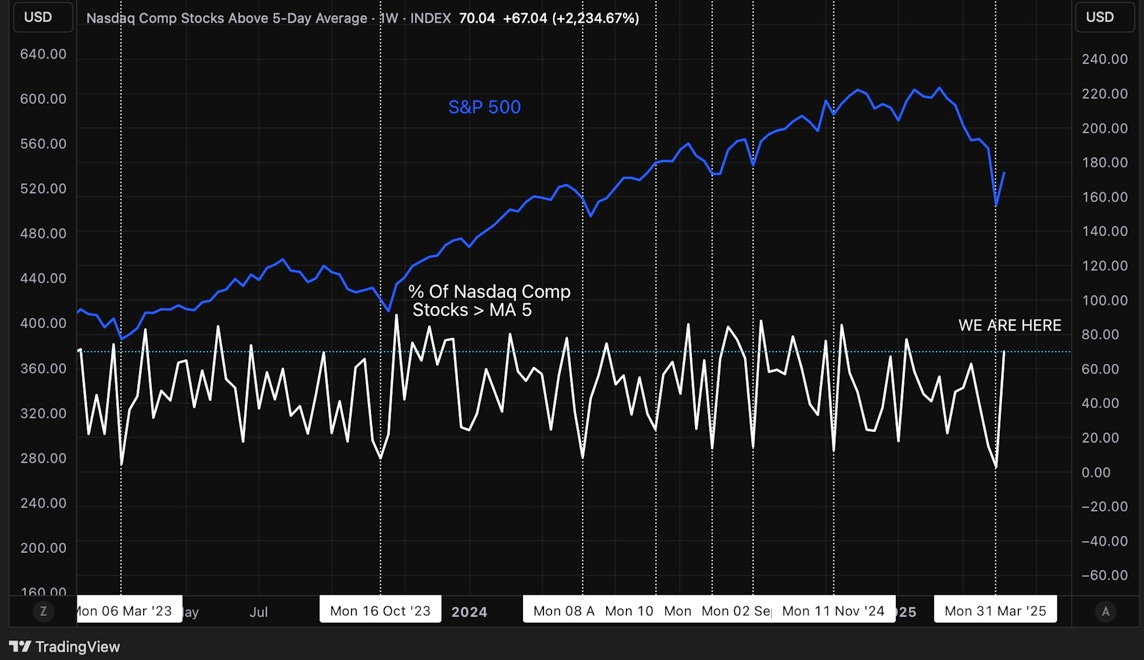
There May Be More Gas Left In The Tank
Nasdaq Composite Stocks over the 5 day moving average, is a very short term breadth indicator. It is not at levels of overbought indicating an immediate reversal down. Also when we get such a powerful impulse, propelling very short term breadth from almost zero to 70% or above, it usually indicates a reversal that lasts for some time. It does not however have any value in indicating the longterm trend going forward. But a push up before we struggle is likely.
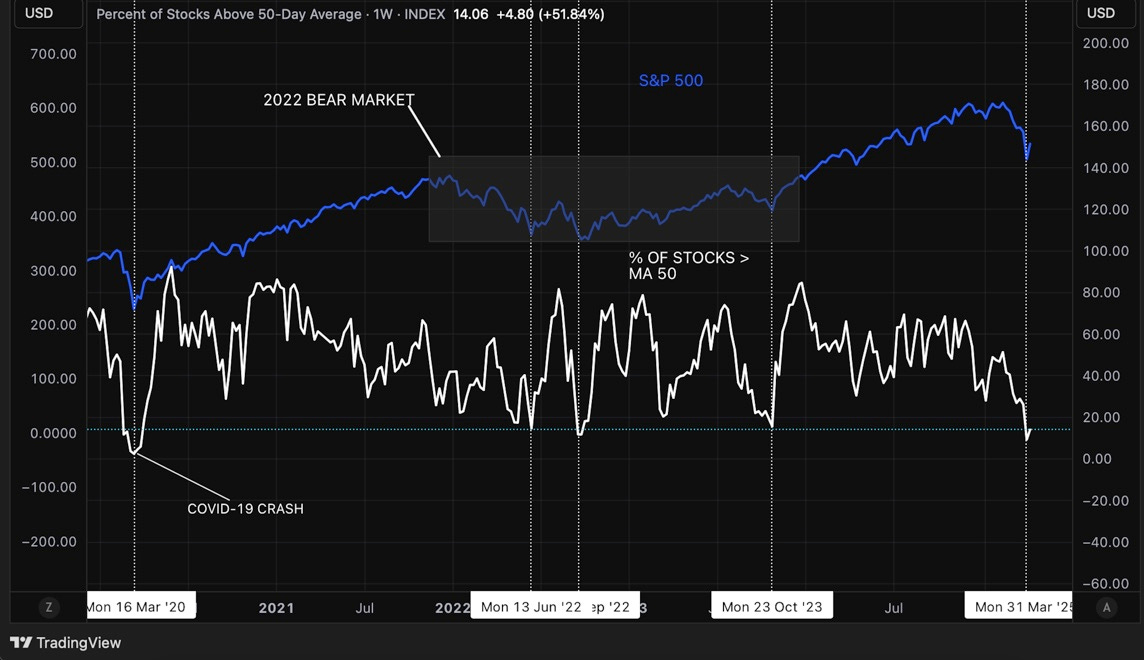
We Are Still Severely Oversold In The Medium To Longterm
Which is a good argument for the bulls. With only 14% of stocks above the 50 day moving average. And only 19% of stocks still in a longterm uptrend and above MA 200. These values are very oversold, last seen at the bottom of the 2022 bear market and the COVID-crash.
This can easily fuel the rally much further up, if the market can stabilize
Dumb Money Finally Capitulated
Which I like. Last week I said that dumb money still aren’t scared enough. This week we finally got a real shakeout, plummeting dumb money confidence to capitulation values. This is bullish.
But they also bought the dip immediately - super brief capitulation counts?
(Source: SentimenTrader.com)

Discount Ends Today - Don’t Forget To Grab It If You Want It
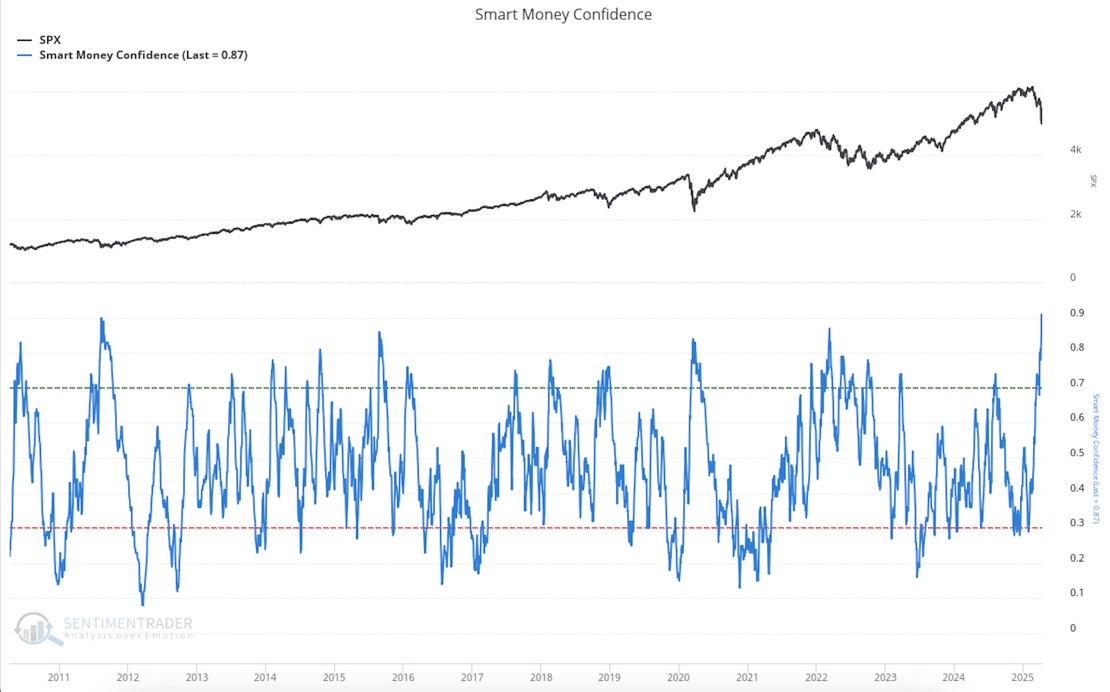
Smart Money Confidence Is Booming
Showing the most optimistic reading in more than 10 years. However, I have showed you before, that this is not a bottoming signal. Since it can spike in the beginning of a decline. I much more like to look at the actual positioning of smart money and hedgers, which we will do further down.
But still a historically high reading is always something
(Source: SentimenTrader.com)
Selling Climax Is Two Things - Volume And Price Reversal
This chart shows the number of stocks in the S&P 500 - that put in a 52 week low, and after that closed above the prior weeks price. Meaning a big reversal in price off lows - a change of character.
77 stocks in the S&P 500 did this move at the same time last week. Looking back historically, it has some significance. When that many stocks reverse off their lows at the same time, it often leads to some kind of short term bottom at least.
Ironically exactly 77 stocks in the S&P 500 made this move when the 2022 bear market bottomed - will become the strangest coincidence if this is the bottom.
(Source: SentimenTrader.com)

There Are Certainly Bullish Signs - But This Is Not A Normal Decline
This is a man-made tradewar crisis that can rock the foundation of globalism
The decline has been a news driven and therefore hard to trade. Since nobody knows what will happen between Trump and China going forward, there is a higher level of uncertainty than in a normal declining stock market
I don’t trade on macro - the price action is always leading. But spiking yields is recessionary and we need to see that resolved to produce longterm gains from here as I discussed in this post