


Controlled Test Of Low — Or The Start Of A Meltdown?

This post is long containing many charts. Your e-mail might cut out a part of it. To ensure you can read the whole post, read it through the Substack app.
I Want To Start With Admiring NUTX
Our high tight flag idea, shared in our most recent post. Breaking out and closing up 9% yesterday, in real relative strength fashion.

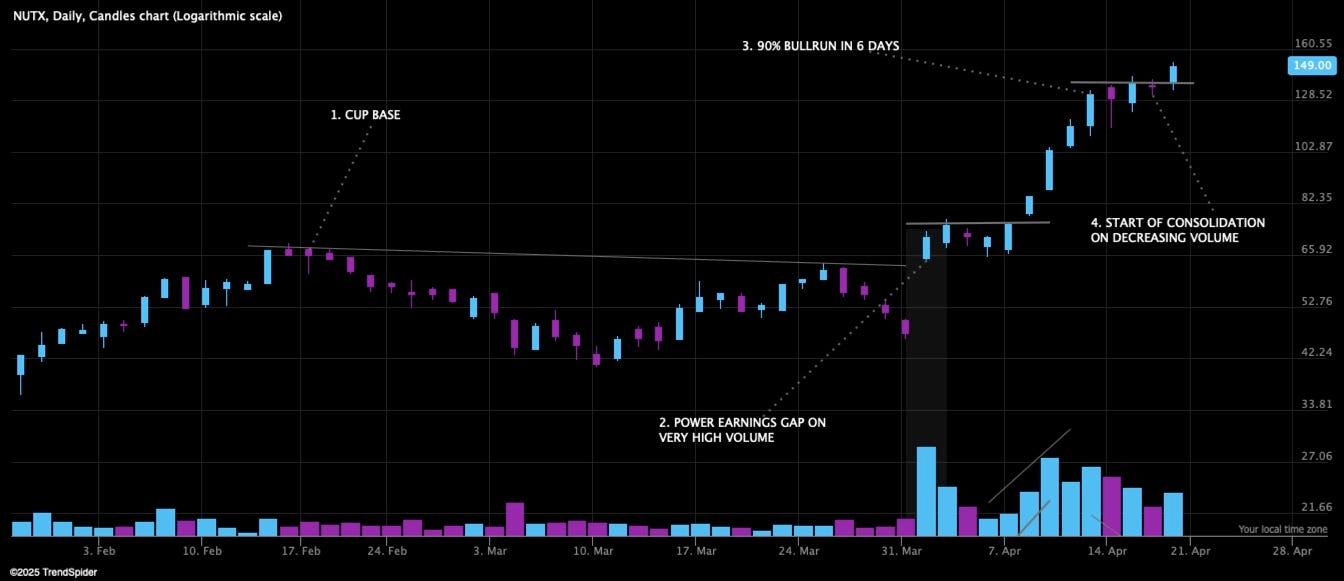
Stocks that double like to double again
Stock Market Is At A Critical Crossroads
And we have a lot to talk about:
We will go through where the major indices stand and where we expect support and resistance
My main scenarios going forward
Fund and institutional positioning and observations
Breadth observations
The behavior of insiders in this decline
Dollar, bonds and yields
Trade plan going forward
Addition of a new tech IPO-stock to our focus list - rallying like there is no tomorrow, while the market is shaking
Buckle up!
Last Week I Told You That This Is Where The Rubber Meets The Road

Because you shouldn’t over interpret oversold rallies. What happens at the highs and the lows of this range is what matters. Everything else is noise.
And I Showed You My Main Scenarios

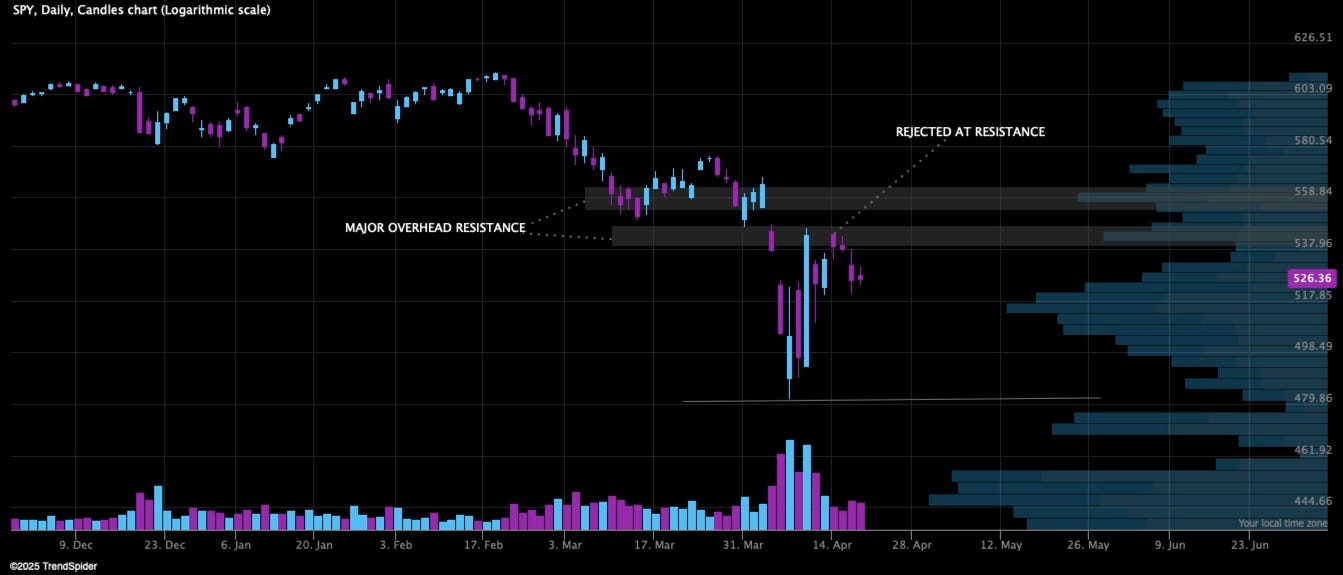
How It Turned Out - Price IS Struggling At The Major Overhead Resistance
Where We Stand — Big Picture
Higher timeframes always supersedes lower timeframes, because the noise is filtered out.
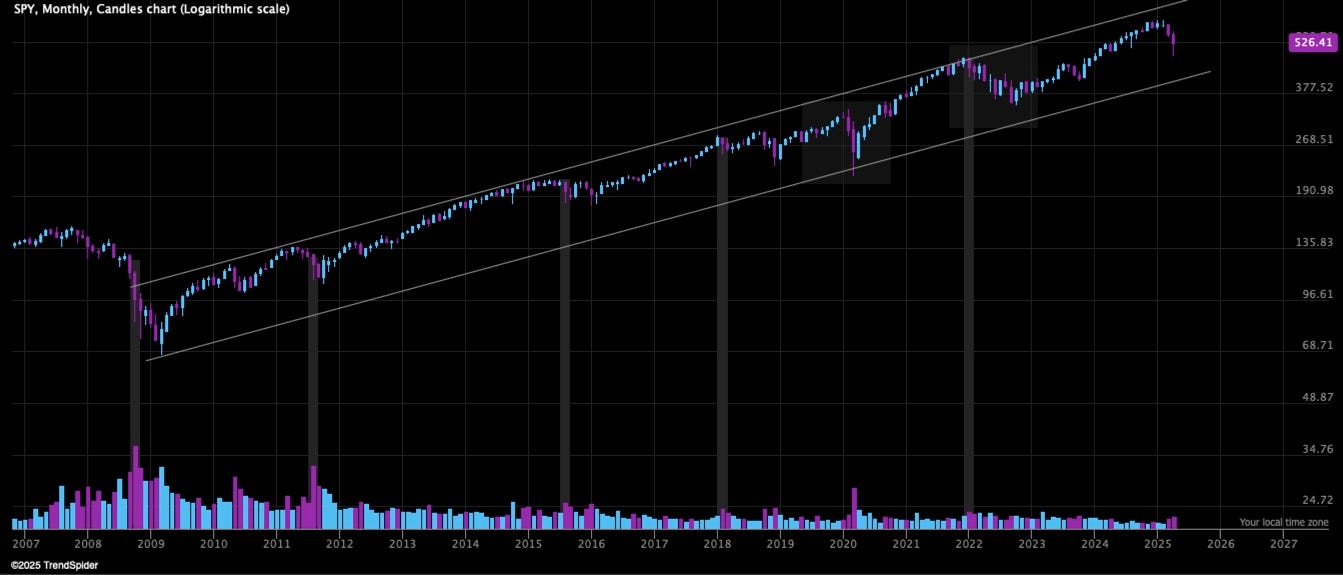
Monthly chart of the S&P 500

We are still in the longterm uptrend channel, established since the 2008 financial crisis. But we are in no-mans-land within the channel, neither near the highs or lows.
The monthly chart also shows how swift this decline has been, resembling the COVID-crash, more than a normal bear market.
Our Monthly Candle So Far Shows Quality Demand Coming In
But if you study the chart, you can see that this is not an indication of a bottom. Since price still can continue down further before we turn, even when we have significant buying in a decline.
Early Supporter Lifetime Discount Ends In Days - Don’t Forget To Grab It If You Want It
A single 10% trade on a $2k position covers a full year of stock ideas and market insights at The Setup Factory
Controlled Test Of Low — Or The Start Of A Meltdown?
Since nobody can predict the future we must follow price for confirmation
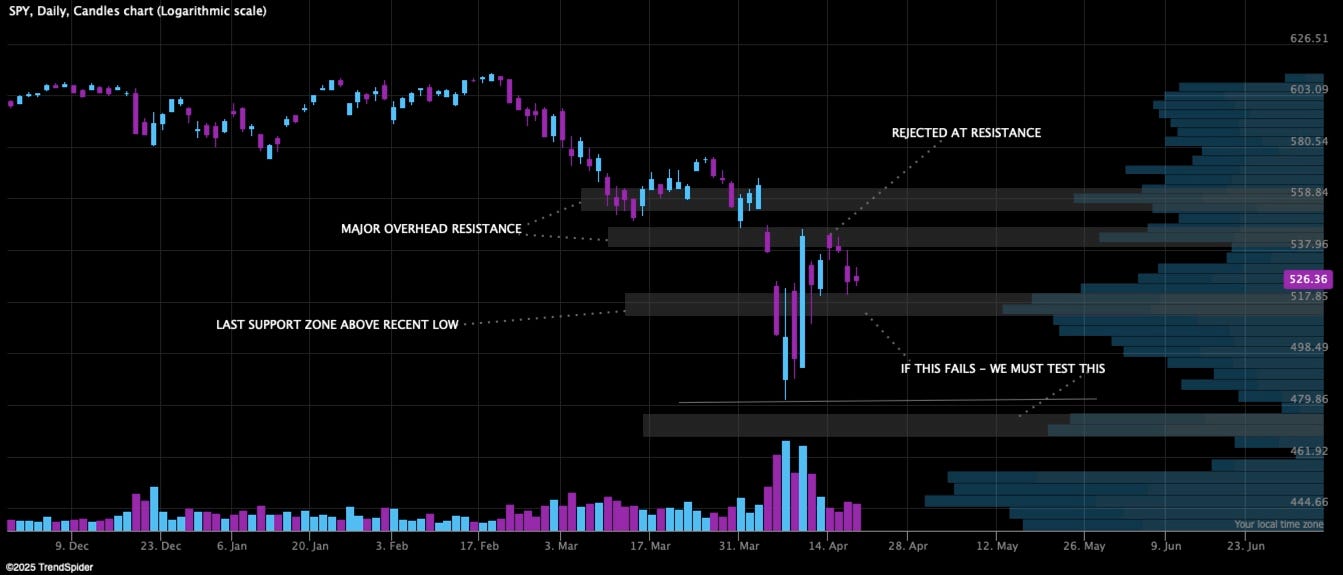
But the way I see it, in the short term, we are oscillating between two liquidity zones —mustering power for a more significant move
If we breach the support zone under us, we will very likely test supply by making a new low or at least touching the recent low
If this happens, I expect most existing setups in leading stocks to fail, which will be our clue
If bulls can bounce off the 5200 support zone, we will most likely be able to make a push higher above the overhead resistance, which increases the likelihood of a real bottom
Looking Under The Hood For Clues - How Likely Is It That We Get A Meltdown?
As we do every week, lets look at interesting charts and observations that can help us understand where we might be heading.
Breadth And S&P 500 - Divergence
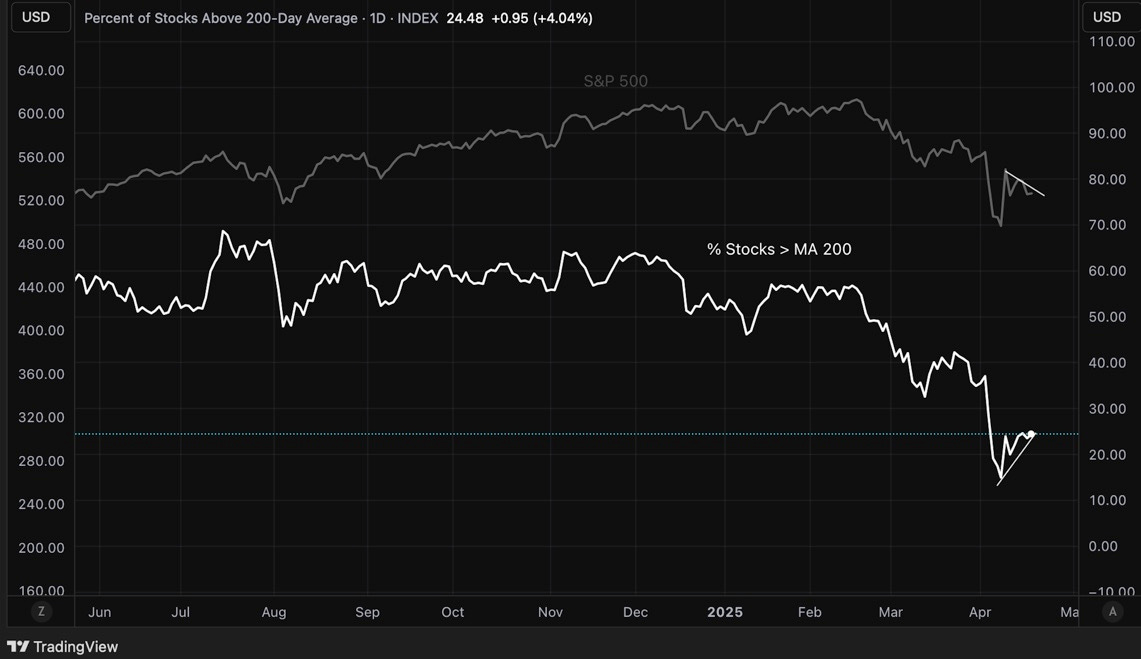
Both intermediate and longterm breadth have improved from its extreme oversold reading, however they are still oversold. Breadth improving is good, but we need it to keep improving.
Breadth also has continued to improve, while the S&P 500 has been declining during the last week.
% Stocks Above 200 Day Moving Average vs S&P 500
Small Cap Effect?
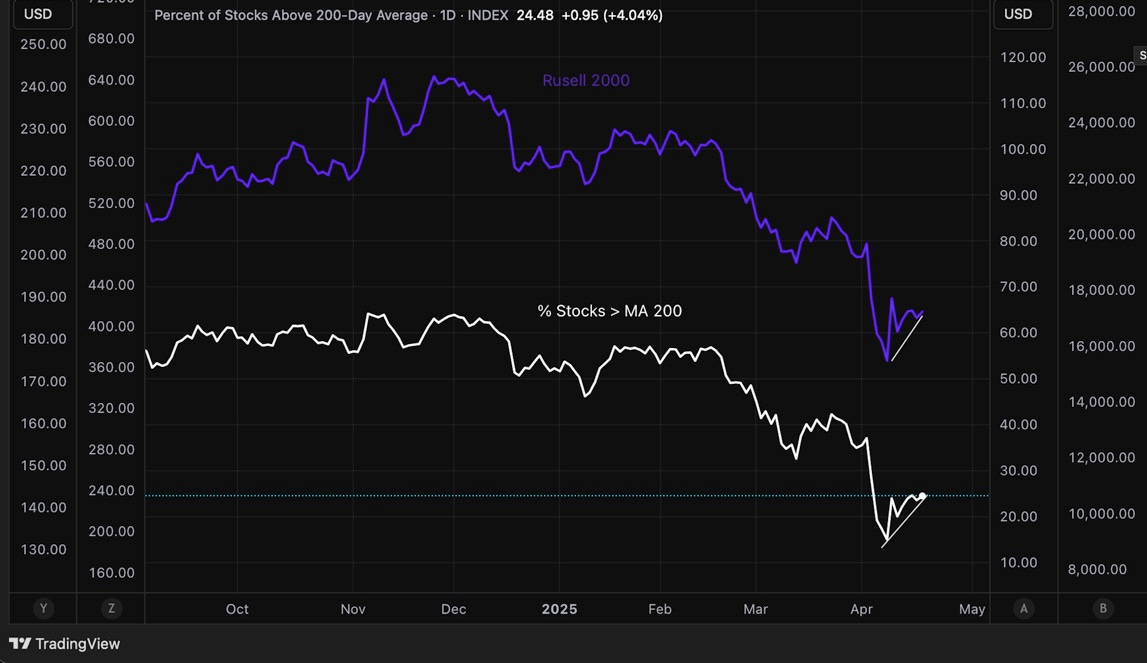
This is probably due to the fact that the Russell 2000, which is a broad small cap index, has been outperforming the S&P 500 during the last days.
In a typical bear market, small caps lead the decline, but also lead the recovery. Bottoming earlier than the large caps. This is still a very early observation, but if we continue seeing breadth improve and small caps outperforming, it could be a sign of a reversal.
Insiders Have Finally Started Buying At An Increasing Pace
Insider transactions have always been of great interest. Since insider selling may have many reasons, it is not a strong signal to study.
Insider buying however, is a stronger signal, that insiders believe in rising stock prices.
But They Are Buying Too Little
If you watch this chart of insider buying, within stocks in the S&P 500, you can see that they are great stock market timers in the longterm. However they are still buying too little.
The level of insider buying we are seeing at the moment, is no bottoming signal. If we compare with the 2022 bear market, the level of buying we are seeing now, is 20% above the 2022 bear market low.
They Are Being Very Suspicious — As Should We Be
(Source: SentimenTrader.com)
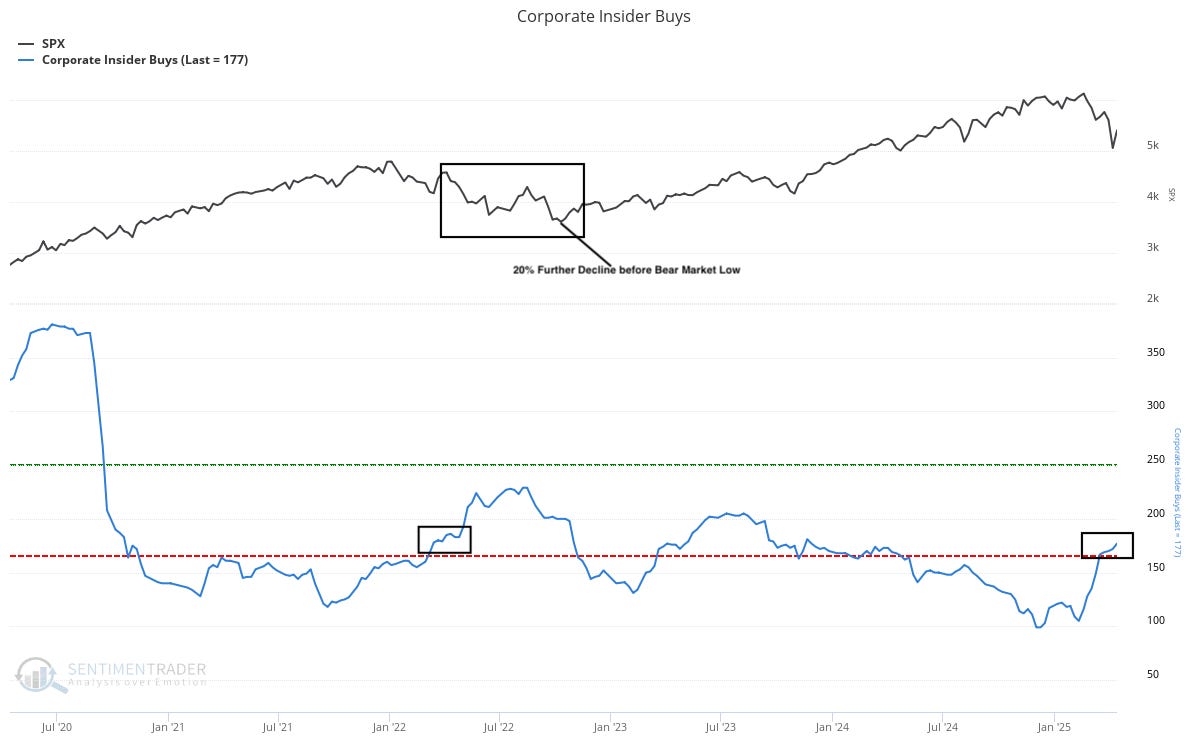
We need to see an aggressive increase in insider buying from here, to have confidence in the recent low.
Everybody Is Buying The Dip - This, I Don’t Like
What you want to see in a bottom is fear or panic. As I have said before we have not seen any form of panic yet. Equity put/call never spiked to panic levels. And stocks declines lately have been very orderly. The last indication of panic we have, is massive fund and institutional outflow from stocks.
Instead We Have Inflows
Both smart money and retail are buying the dip, with retail accelerating their buying and smart money decreasing their buying. This would support the thesis of a short term decrease in stock prices.
(Source: SentimenTrader.com)

And We Haven’t Had A Single Week Of ETF Outflows — Since The Decline Started
This is also very bearish. We need fear to put in a bottom, and heavy outflows is a great contrarian bet that stock prices will increase.
(Source: SentimenTrader.com)

Cash Levels Are At All Time Low - Everybody Is All In Stocks
This chart shows the cash levels of mutual funds. Generally it is a contrarian indicator, high cash levels are bullish - because you have fear, and potential for heavy inflow of capital to drive future stock price advances.
Mutual funds are raising cash, but the cash level is lower than ever before —as if we are in raging bull market
(Source: SentimenTrader.com)

As You Can See There Are More Bearish Signs Than Bullish
But this is not a normal decline, as I said last week. This is a man-made global crisis. Therefore you must interpret these signs in the context we are in:
Either we are in for a real meltdown and probably looking forward to a 20% decline from where we stand
Or smart money knows something we do not — If I just look at the signs I can observe, they seem convinced that Trump will fix this mess - before it gets out of control
The institutional and smart money actions and positioning, does not indicate fear — Are they being dumb money?
Or are they confident that the tariff crisis is temporary? In my opinion probably the latter
But Then There Is The Dollar, The Bonds And The Yields
Which all affect where we are heading
The Decline Of The Dollar And Stocks Together — Not A Common Thing
More commonly, when the stock market falls, the dollar strengthens. It is very rare to see both fall together. When they decline together, this is usually due to a repatriation trade — occurring in periods of extreme geopolitical uncertainty.
Countries return their assets to their own currencies and sell the dollar
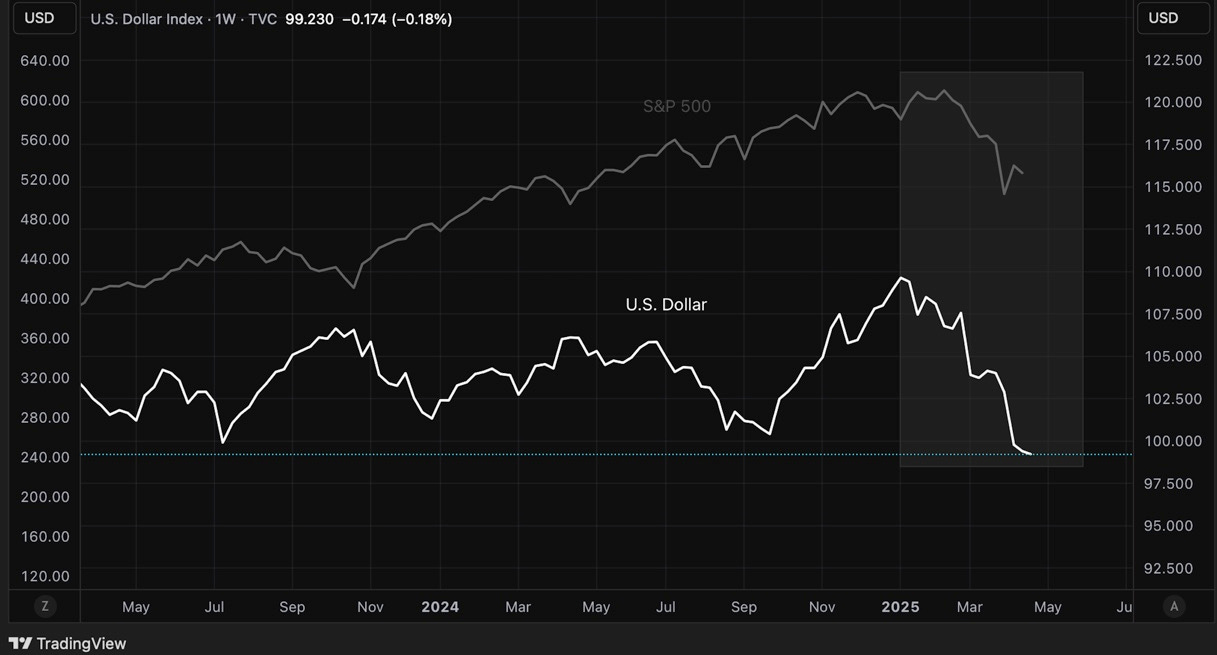
Looking back historically, periods of declining dollar alongside declining equities, have poor results. The S&P 500 put in a lower low most of the times when this occurred.
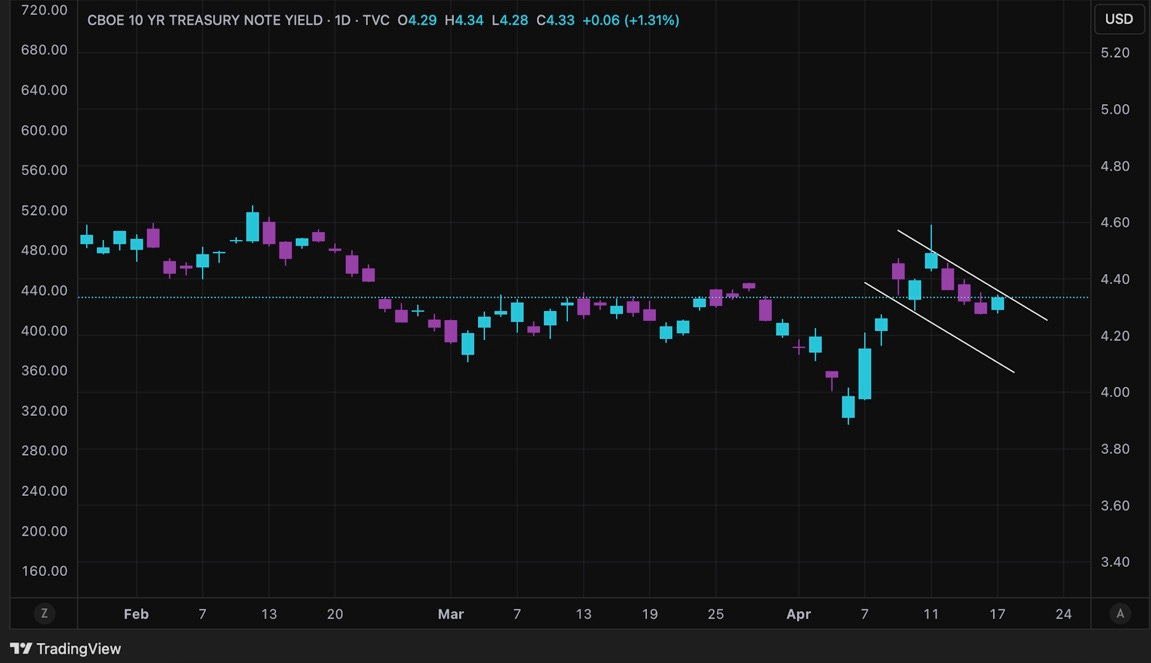
Yields Are Looking Too Happy
As I explained in this post, high yields and the dumping of bonds are recessionary. This is a real concern, that needs to shift quickly, if we want to see the stock market to turn.

TNX - 10 Year Treasury Note Yield
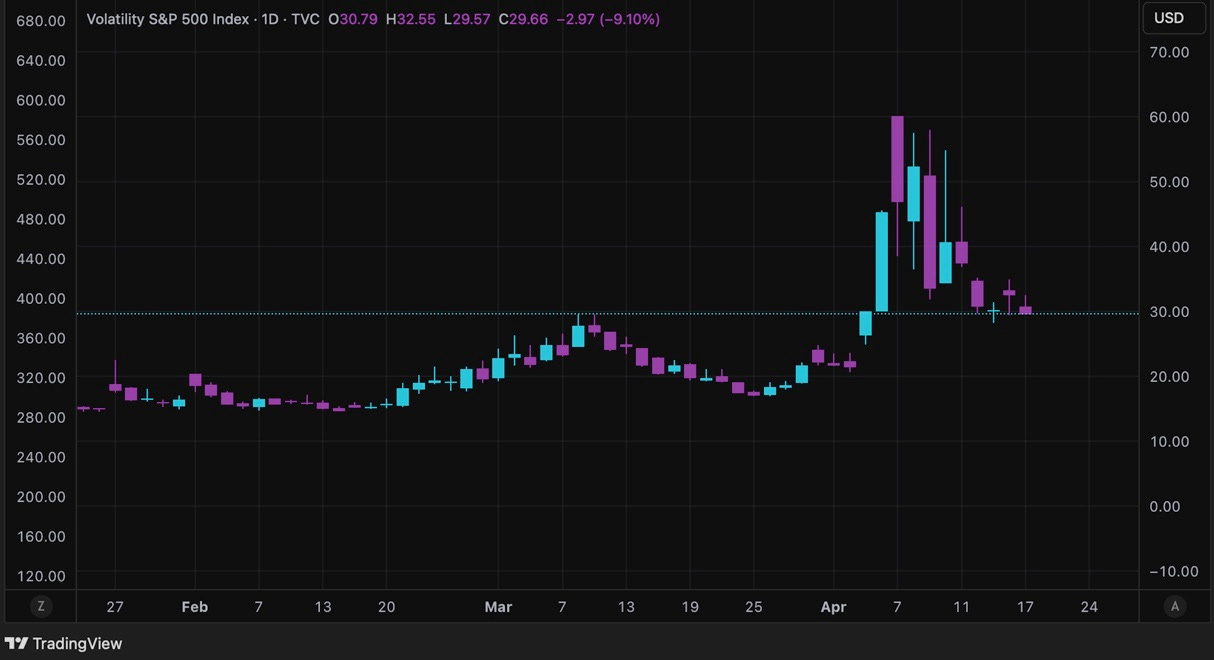
VIX Stubbornly Resisting Decline
Hovering around 30 or above for the second week in a row. As I have said before, a VIX <20 significantly increases the chance of rising stock prices. Watch it during the week.
There Are Signs For Both The Bears And Bulls
But in the end we live in the hands of Trump
In my opinion the stock market is desperate for good news — shorting is not an option where we stand, with the potential news flow
Smart money and institutions are not positioned for a big decline - yet
Fed throwing Trump under the bus — is putting high pressure on him to close deals and turn this mess around
I Do Not Believe Trump Will Let The Stock Market Crash
Together with the current positioning and sentiment observations — I believe we are close to a significant bottom, but we may have to test the recent low or put in a lower low first — nobody knows
Regardless of my scenarios, this will not affect our execution — We do not predict, we react
We will continue follow price and the actions of leading stocks for direction on how to act going forward
I have talked about how I act during times like this, buy one or two stocks, keep your position size very low — let the trades show you the way
If they work out, we will increase our exposure
if we are consistently getting stopped out, the market will force us to a 100% cash position
Bear Markets Come And Go
Better times will always come — No bear market has lasted forever
Lets Finish With An Tech-IPO Showing Immense Strength
I have been following Servicetitan (Ticker: TTAN) for a long time. I wanted to bring it to you when it was ready. However it suddenly broke in a weak way with low volume. I thought it would never work, but it rallied anyway and the volume picked up.
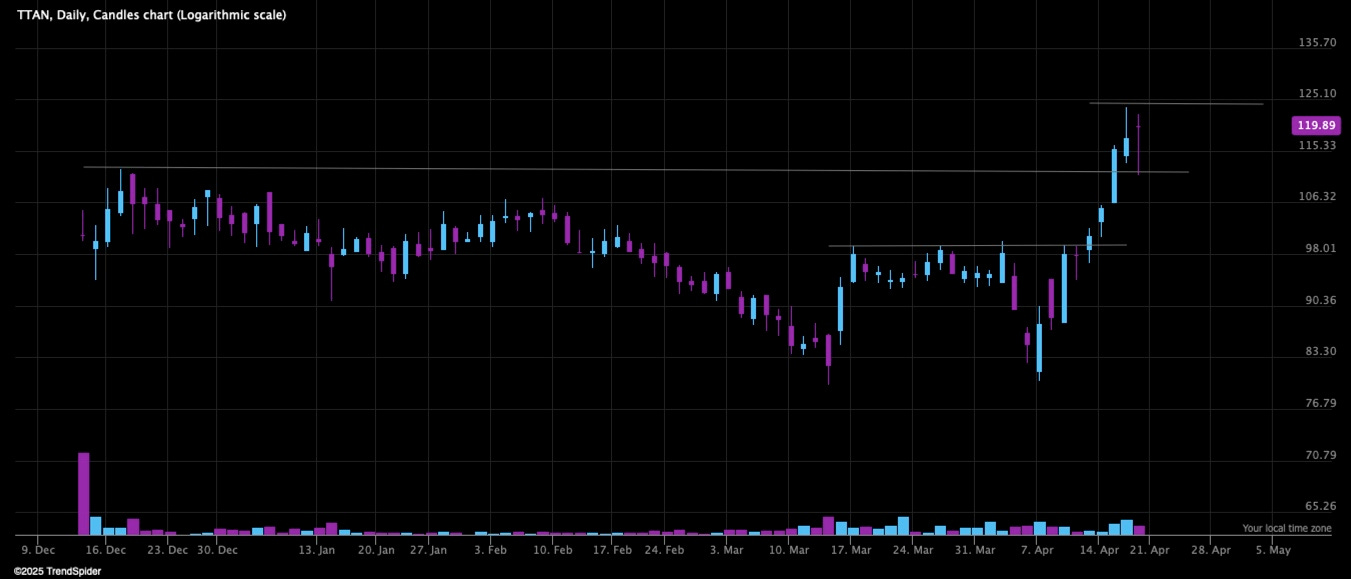
But the best buys are after a stock is showing strength. It broke above its IPO-price for the first time this week. Look for a tight consolidation before a continuation move to new highs.
Hope this helps and thank you for reading. If you liked it, feel free to share it.
Charts courtesy of SentimenTrader.com
https://sentimentrader.com/subscribe-newsletter
Charts courtesy of TradingView
Charts courtesy of TrendSpider
Disclaimer:The Setup Factory is not licensed to give any investment advice. The content provided in this email and from this Substack-account is my own thoughts and ideas about the stock market. It is for educational purposes only and should not be considered as any form of investment advice. Do not invest in any stock based solely on the information provided here. Trading stocks is highly speculative and involves a high degree of risk of loss. You could lose some or all of your money. You should conduct your own research and due diligence in any investment you do, to verify any information provided.