


Which Direction Is The Pain Trade?

The TSF - Focus Stocks Page Will Be Updated Tonight
For all paid subscribers — with the five best setups and opportunities going into this week, complete with methods on how to catch them.
You can also find my portfolio at the bottom of the page.

Today We Have An Important Job To Do
I conveyed to you before last week started, that I perceived an elevated risk in the market due to several factors.
As you know my portfolio exposure is under 50%, and we will see how the week unfolds, but it is likely to decrease even more.
We are at a significant crossroads, and as last week closed, we see several changes of character and cautionary signs that we need to pay attention to.
The setups are the fun part, but the most valuable part of this publication, is likely the market analysis that tries to align us with the bigger trends and finding the important signs under the hood — before the bigger trends and declines actually unfold.
Protecting your capital is the easiest way to make money in the long run.
There are a big number of finance substacks only providing this type of analysis once a week, at the same buck as we do — but we focus on value and give you 10x that in a week.
Three Weeks Ago I Shared With You My Main Scenario For Where We Might Be Heading
And showed you this chart with the text below.
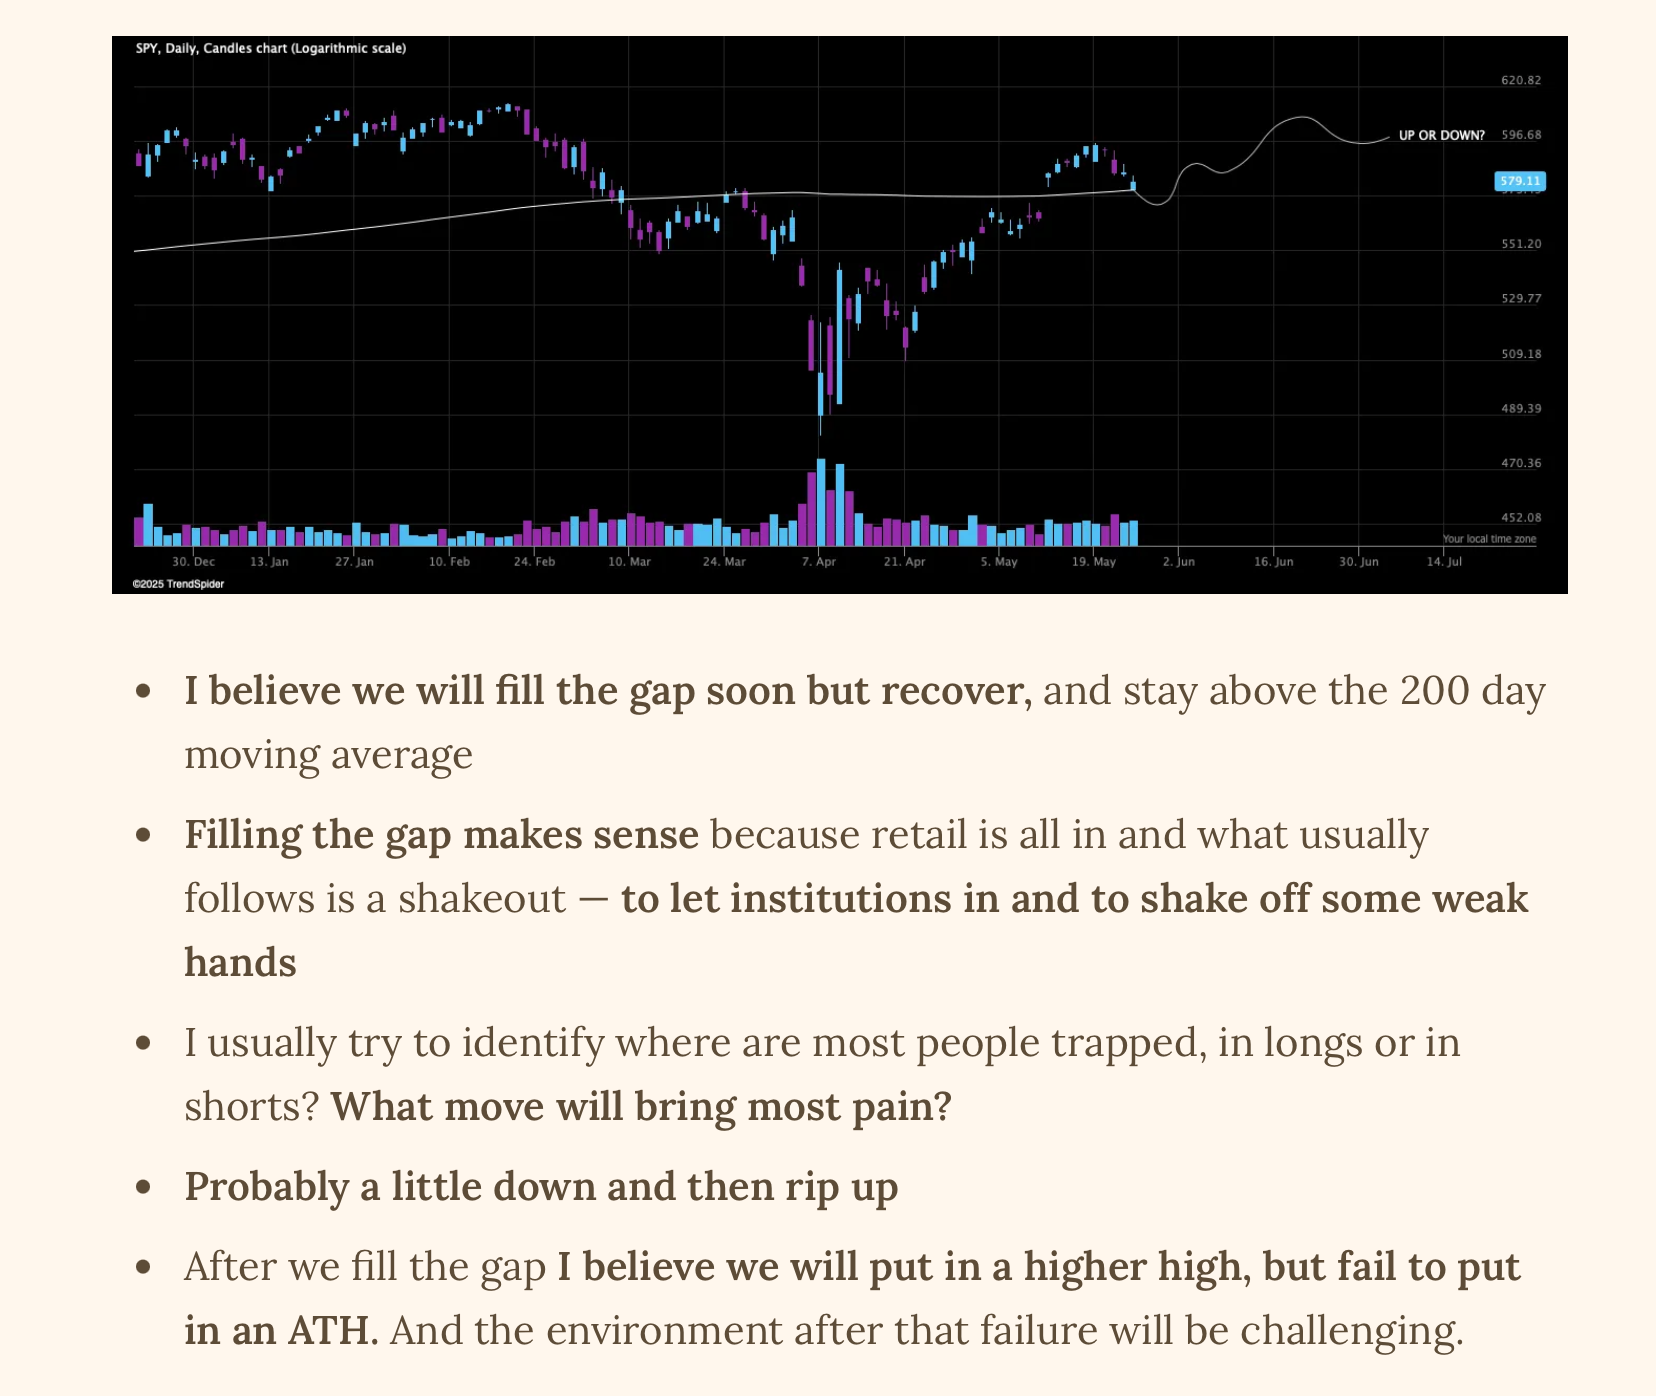
So Far That Has Been A Fairly Accurate Scenario

We have now ripped up, put in a higher high and so far failed to put in an ATH.
We did not however fill the gap — hopefully we will not fill it now either, but as you know most gaps get filled eventually
Today’s Analysis Is Packed
Several breadth observations continue to confirm the elevated risk in this advance
MAGS
VIX
Small caps are ahead of the market
Hedge fund positioning with a clear change of character
IPOs behavior giving us clues
Heavy capital flow shorting the Iran War reaction immediately — interpret this correctly
An overly confident market is failure prone market
Retail bought for their life
Skew-index
Never forget to zoom out
TSF-community trade plan
Iran, oil and gas
Don’t fight the fed
Buckle up!
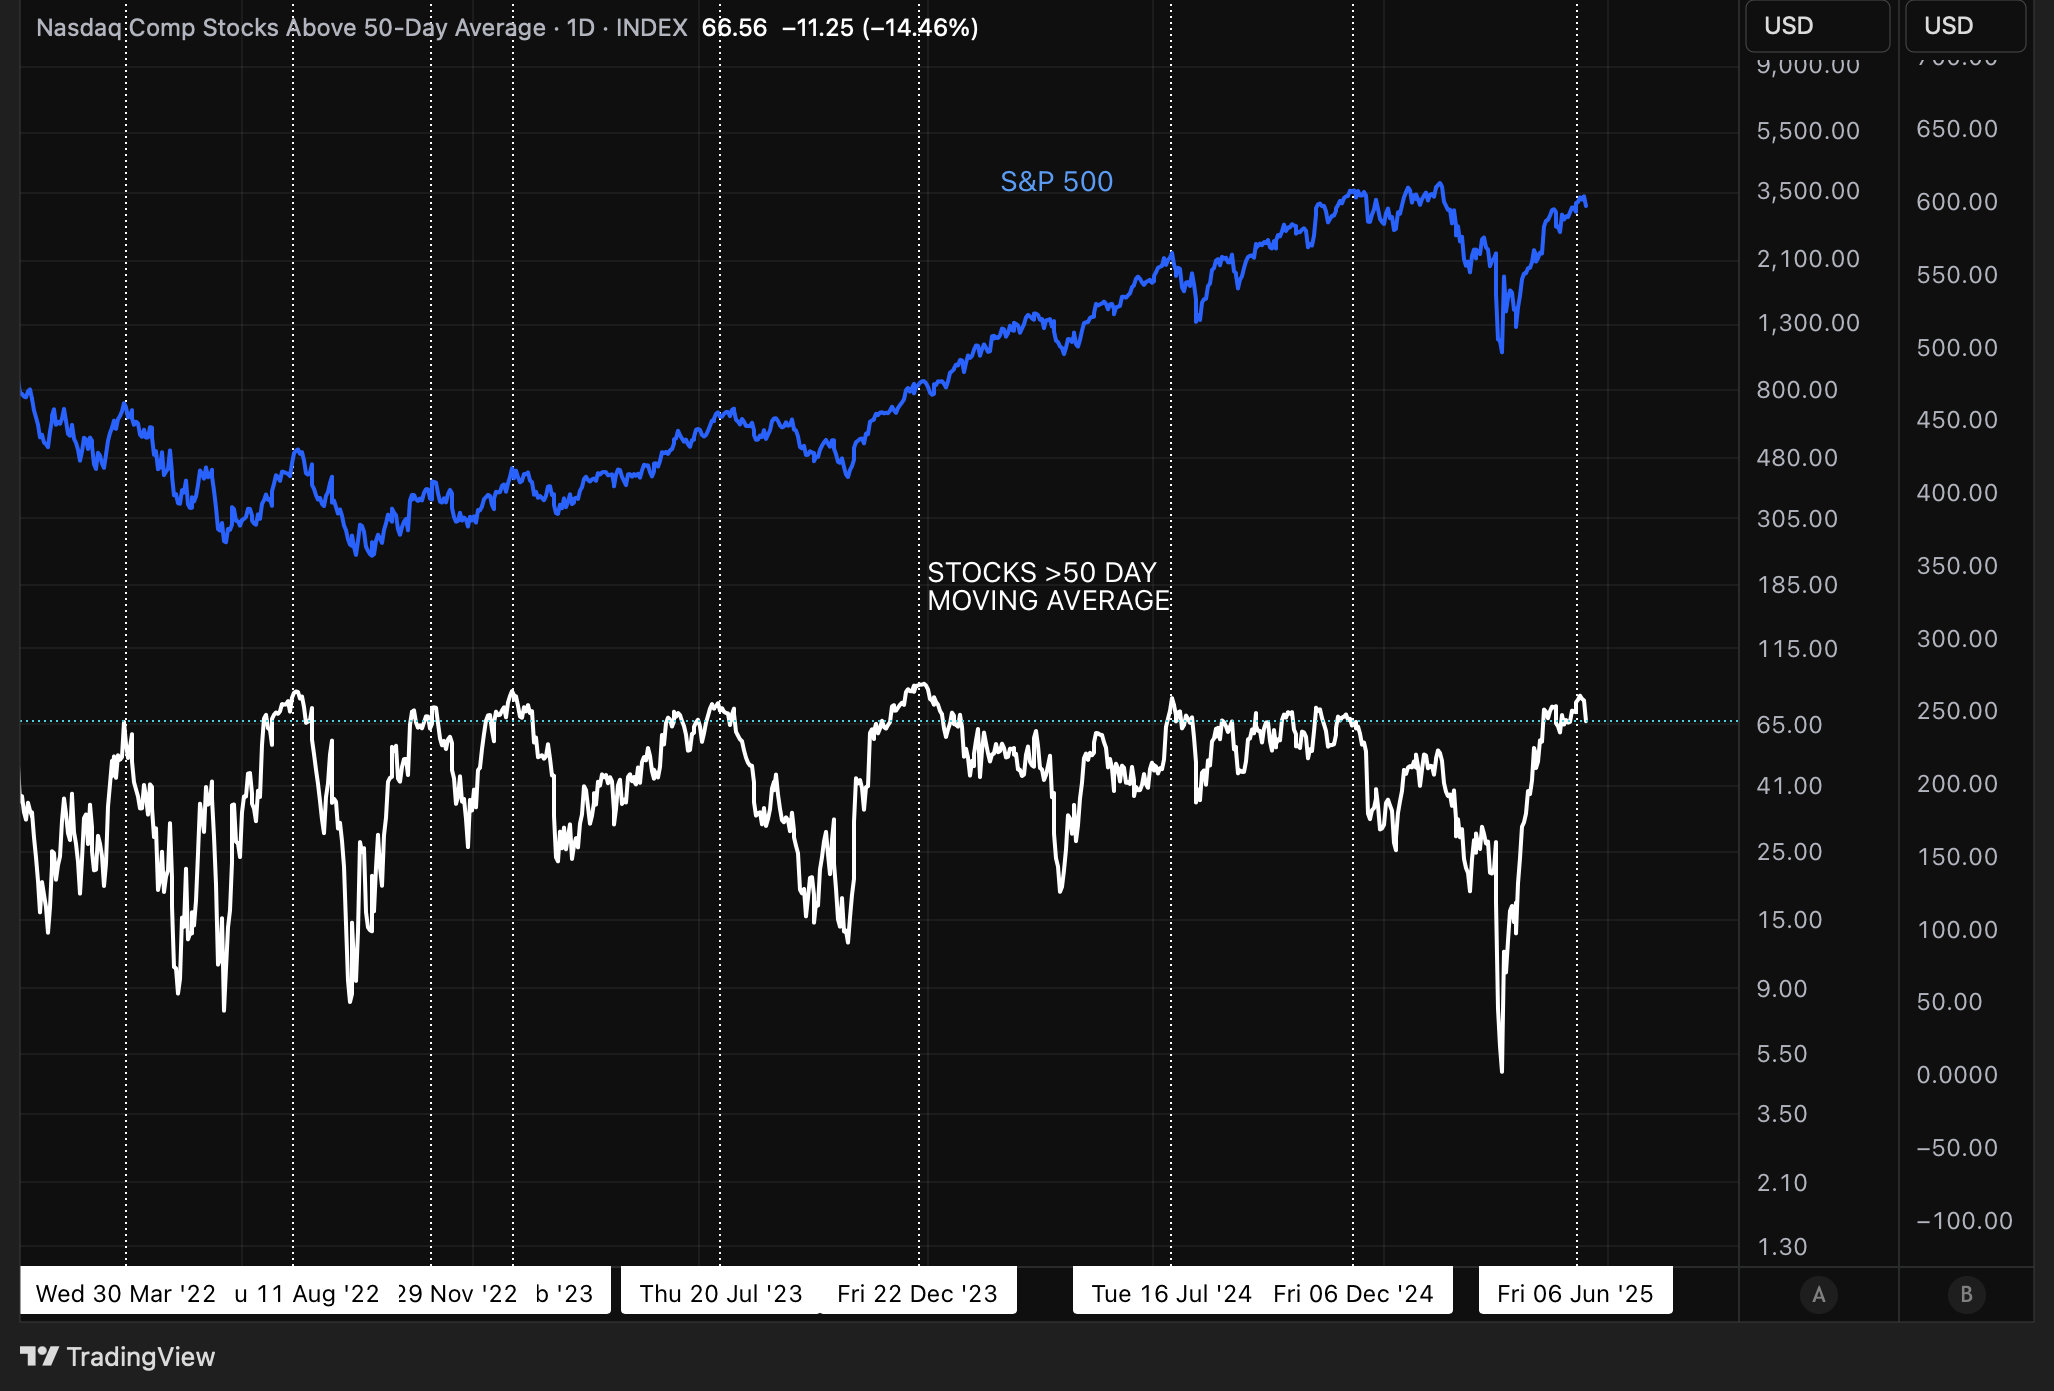
Longterm Breadth Deteriorating From Low Levels
Poor longterm breadth as we advance, has been my major concern during the last weeks. Because expanding breadth with an advancing market is a sign of a healthy market.
We are still not in a healthy environment.
Only 41% of stocks are above the the 200 day moving average, and thus the majority of stocks is in a bear market — while we are a couple percent from ATH.
% Of Stocks Above 200 Day Moving Average

This Is A Red Flag But Not Panic Mode
And I will explain why. What we see now, is that when the market advances, longterm breadth also advances.
This is good. A very bearish sign is breadth divergence, meaning the market is making new highs while breadth is declining.
We are not seeing this yet, we are just seeing major hesitation to advance in the majority of stocks in the market.
The time before the 2022 bear market is a prime example of an incredibly unhealthy market — as you can see in the chart above.
Longterm Breadth Might Improve — If Medium Term Breadth Can Cool Down
There is still hope for this advance to be sustainable, because medium term breadth was overbought. I told you last week that a pullback or pause is likely because of short to medium term breadth overheating.
If stocks can consolidate and form bases making medium term breadth cool off, this can set us up for a real new thrust up in longterm breadth.
Which is a necessity for a healthy bull market to unfold.
Nasdaq Composite % Of Stocks Above 50 Day Moving Average
We are in expected and normal correction levels of medium term breadth. The random individual stock should build a consolidation and base, setting us up for the next run up.
In leading stocks this is already happening, if you look at for example HOOD, PLTR, CRWV, NFLX, CRWD and many more.
This is the bullish thesis, and our major red flag is if our leaders turn down violating the breakouts they made from their multi month bases.
That would be a sign of an unnatural imminent decline, and a cue to go 100% cash quickly.
While The S&P 500 Is Barely Down Stocks Are Being Slaughtered
Maybe you aren’t seeing this, since we focus on the absolute best leading stocks. But I haven’t seen this many failed breakouts, bearish reversals and failed earnings gaps in a long time.
This is a cause of concern and something you should react to, if they don’t shape up quickly.
If This Is The Start Of A Normal Pullback Our Growth Stocks Should Bounce Up Soon
Because when looking at very short term breadth, we are approaching levels of oversold where we usually get an impulse up.
If this is the start of something uglier, we will see further deteriorating short term breadth - not usually seen in a normal pullback, in an up trending market.
This would be another red flag for us to pay attention to.
% Of Nasdaq Composite Stocks Above 5 Day Moving Average

If MAGS Worried Me Last Week
I am breathing in a bag this week. MAGS just can’t do it, it can’t reclaim the longterm uptrend channel.

For every week this continues, the likelihood for a failure increases.
And if MAGS turn down, the market will turn down.
Be Careful If You Start Seeing VIX Living Above 20 Again
High VIX — favors a bearish environment.
Low VIX under 20 — favors the advance of the stock market.

VIX made a pop that doesn’t look that scary yet, but watch it closely during the week.
A significant bullish change of character indicates that a much higher spike is coming.
Small Caps Made An Amazing Run And Then Died
Since I say it every week, I will continue this week as well.
Small caps lead the advance and lead the decline.
Russell 2000 is still not confirming the bull market.

Russel 2000 made a very ugly bearish reversal.
It failed to reclaim the 200 day moving average, breaking its up trending line, that it has held since the very low.
It did so on the highest volume since we bottomed.
That is bearish and my second red flag this week, and the second most important after deteriorating breadth.
Hedge Funds Already Rotated Their Capital
A couple of weeks ago I told you about the relationship between hedge fund exposure to equities and bonds — the two main asset classes that hedge funds move between.
Since the pool of capital in hedge funds is vast, they are market movers. Capital flow will inevitable move from the over-owned asset class to the under-owned.
Hedge funds sold equities at an impressive rate recently and rotated into bonds.
This is good, because it means that the potential capital flow into equities from hedge funds is high — because they are returning from under-owned levels in equities.
(Source: SentimenTrader.com)

It does not mean it will happen overnight — but they look ready to buy the dip.
IPOs Starting To Crash — Slightly
They can still recover, but we see a clear change of character in the behavior of IPOs. They are underperforming the S&P 500 significantly.
This is can be an indication of the start of a more significant risk off environment and decline. It is still early however and they can recover.
Renaissance IPO ETF With RS-Line

But it is a very clear change change of character, compared to the environment we were in when we bottomed.
And our third red flag this week.
Inverse ETF Capital Flow Spiking
Tracking the volume into inverse ETFs of the major indices, is a great way to find a bottom. When volumes shorting the market is spiking, we usually go the other way.
In one day we jumped from low levels of shorting, to extreme levels of capital shorting the market.
(Source: SentimenTrader.com)

It can become much more extreme and it is not a sign that we will turn immediately. But this very quick nervousness is usually bullish, because the market will most often move toward the pain trade.
We Need More Fear
All significant bottoms need some fear — which we can follow by tracking equity put/call.
The market is overly confident, and an overly confident market usually needs to test supply.
Looking at equity put/call we saw no fear on Friday, despite the macro events unfolding.
At the same time retail bought for their life and are still excessively exposed to equities. They are losing some confidence but from extremely high levels of buying.
(Source: SentimenTrader.com)

Skew Index Increasing But Not Yet Alarming
Skew index shows us how smart money option traders assess the risk of a sudden and significant black swan decline or event.
It is creeping up from low levels, if it continue increasing, that is something that should make us really think about the market health.
As I have said before — every spike in skew does not lead to a significant decline.
But every spike in skew should be taken seriously.
(Source: SentimenTrader.com)

Lastly Never Forget To Zoom Out
Simply by looking at some important weekly charts you will understand my recommendation of caution.
S&P 500

XLK — Tech Sector ETF

QQQ

Lastly Silver Setting Up Again
After our first buy suggestion it broke out, it is now consolidating nicely and looks like it is preparing for its next move.

The Roadmap
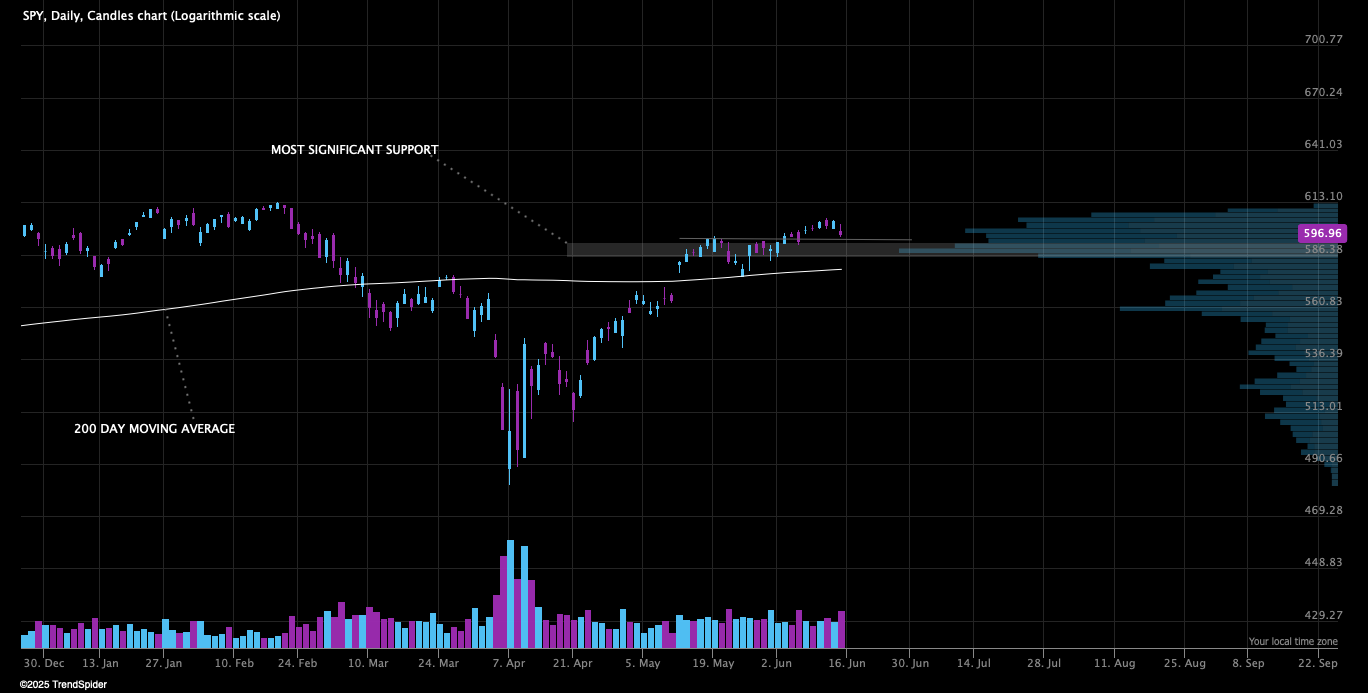
It is normal for us to pullback after such a bullrun — declining some is expected
The level to watch in the short term is 5900
This is our closest significant support and liquidity zone — when we are close to significant levels they are almost always tested
I expect us to arrive there very soon, which should provide some support in the beginning of the week
If this level fails we will most likely test the 200 day moving average — what happens at that test will be very important
Nobody Knows Where We Are Heading
But as you know I like to have my scenarios. And I usually ask myself — which direction is the pain trade that hurts the most?
As I lay the puzzle I see buyers coming in fairly quickly providing short term support. The name of the game this year is choppy action, and I believe we will oscillate here for a while before choosing direction.
If smart money turn bearish for real, it is unlikely that we will decline immediately. Smart money and institutions usually let prices pause or advance so they can make time to sell into retail.
Oscillating without a sharp declines allows for this.
So my short answer on where the pain trade is — Probably a little down, rip up and more down.
It feels too easy to just continue declining from here, we will probably get whipped around a little before the real move comes — wherever that is.
The Bottomline
We still clearly see a difficult trading environment for trend following strategies
We see failing breakouts and bearish reversals — with no meaningful advance away from multi month bases
Breadth is confirming the poor health of the market
This does not mean that this decline will lead us to a new bear market — it simply means we should not push and control our risk
Leading stocks are yet to flash any real red flags signaling an imminent crash — but that can change quickly
Monitoring the actions of leading stocks is the single most important thing you can do, to align yourself correctly in the current market conditions
If leading stocks hold up and respect their breakout levels— you should still participate in the market
I barely had any subscribers when we started declining in late February, but I went 100% cash within two days due to the fact that all my holdings made sharp bearish reversals breaking key levels — at the same time
If we see similar action that is a cue to go 100% cash without hesitating
I recommend caution and a portfolio exposure under 40-50% — you can always increase it quickly if your stocks start breaking out again
This is still a stock pickers and aggressive profit takers market, trade accordingly and cut your losses with a passion
What I will do is to respect my stop loss levels
if we see further deterioration, I will cut all of my weakest holdings and only keep the best that are showing relative strength — this would reduce my exposure further to 20-30% within days
Having said all this, nobody knows where we are heading. Don’t turn too bearish or bullish, simply respect your stop loss levels and the market will decide your exposure.
A Last Short Note On Macro And Fed
The war we are seeing is likely to escalate. War by itself is nothing that makes us reduce exposure — several wars saw booming bull markets.
An energy crisis however will have a significant negative impact on equities. High oil and gas prices will likely continue — this is inflationary and recessionary in the long run.
The effects of this will not come immediately but later on.
But the words out of Jerome Powells mouth will come on Wednesday — I am no macro man so take it for what it is, but since Powell has been very hawkish lately.
An inflationary energy crisis will most likely make him even more hawkish — this can cause a significant decline by itself in my opinion.
I will personally not go heavy into Wednesday without a significant cushion in my holdings.
Hope this helps and thank you for reading, if you liked it feel free to share it.
Charts courtesy of SentimenTrader.com
https://sentimentrader.com/subscribe-newsletter
Charts courtesy of TradingView
Charts courtesy of TrendSpider
Disclaimer:The Setup Factory is not licensed to give any investment advice. The content provided in this email and from this Substack-account is my own thoughts and ideas about the stock market. It is for educational purposes only and should not be considered as any form of investment advice. Do not invest in any stock based solely on the information provided here. Trading stocks is highly speculative and involves a high degree of risk of loss. You could lose some or all of your money. You should conduct your own research and due diligence in any investment you do, to verify any information provided.