


Waiting For The Move

The TSF - Focus Stocks Page Is Updated
For all paid subscribers — with the five best setups and opportunities going into this week and how to catch them.
You can also find my portfolio at the bottom of the page.

And Don’t Miss Our Last Discount Of 2025 — Ending Tomorrow
As a celebration of us reaching 1,000 subscribers we are offering this one-time chance to lock in your life-time price — price increases are coming.
Here’s a look at some of our recent winning stocks.

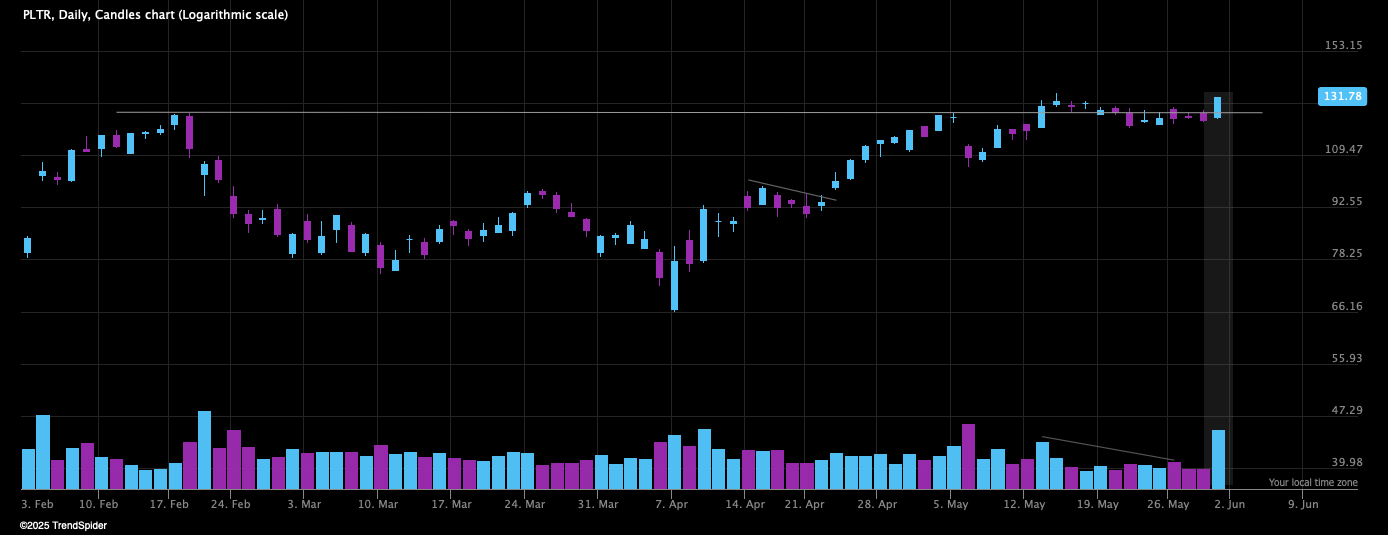
Before We Start We Need To Talk About Palantir
I had a position from the initial breakout two weeks ago, but I reduced it during the week because it was clearly underperforming and showing weakness.
I updated my view on PLTR last week

What It Did Was Shake Off The Weak Hands Immediately

We had a clear plan for it, and I wanted to add on bullish break above the 128 USD low pivot — it never violated the low of the day.
This clearly shows why you should put your stop losses at logical levels for the stock and not for yourself.
A true bullish move or breakout should never violate the price that initiated that move.
Always wait for the close — as long the stock doesn’t violate your stop loss. Cutting stocks on emotion is bad strategy.
Insane Intraday Shakeout And Now A Thing Of Beauty
Now Lets Dive Under The Hood And Analyze The Market Conditions
Market is in clear indecision. We are mustering power for a bigger move.
Todays Agenda:
Breaking down the S&P 500 in detail and the levels to watch
Breadth observations
MAGS
VIX — Smart money bets on VIX direction is showing a change of character
The Market Sentiment Cycle showing discouragement
How shorted is this rally?
IPOs behavior and what it tells us about the risk sentiment
Seasonality matters?
Gold
Bitcoin
One ETF breaking out
Buckle up!
Last Week I Told You We Have A New Range To Analyze

And showed you this hourly chart of the S&P 500 testing the gap
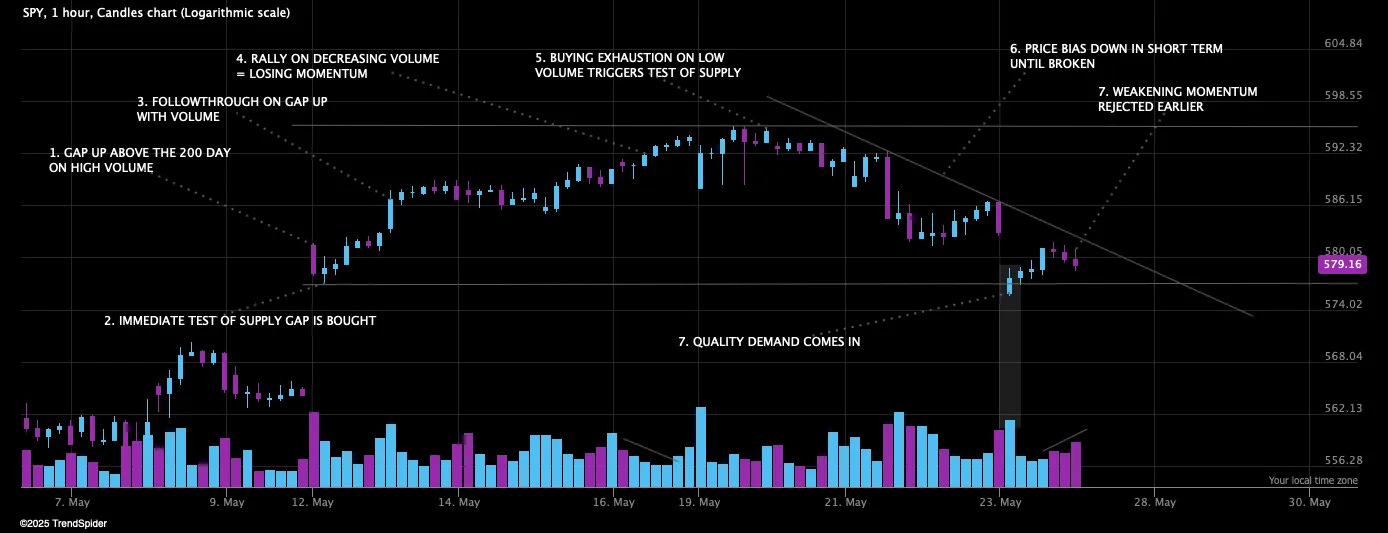
I thought we would fill the gap, but put in a normal decline. We saw no signs of an impending significant decline in our last market analysis.
Instead we ripped, and so far left the rest of the gap unfilled.
The range now gives some clues for us on what might be the coming direction.

What is great is that we did not violate the low that tested the gap — and after that we have put in another higher low
We have not yet put in a higher high — which we need to confirm the bullish thesis
What we see is that quality demand comes in at every test of supply — which is encouraging
But we still have indecision until we leave this range
My Main Scenario One Month Ago Was A Comfortable Chop
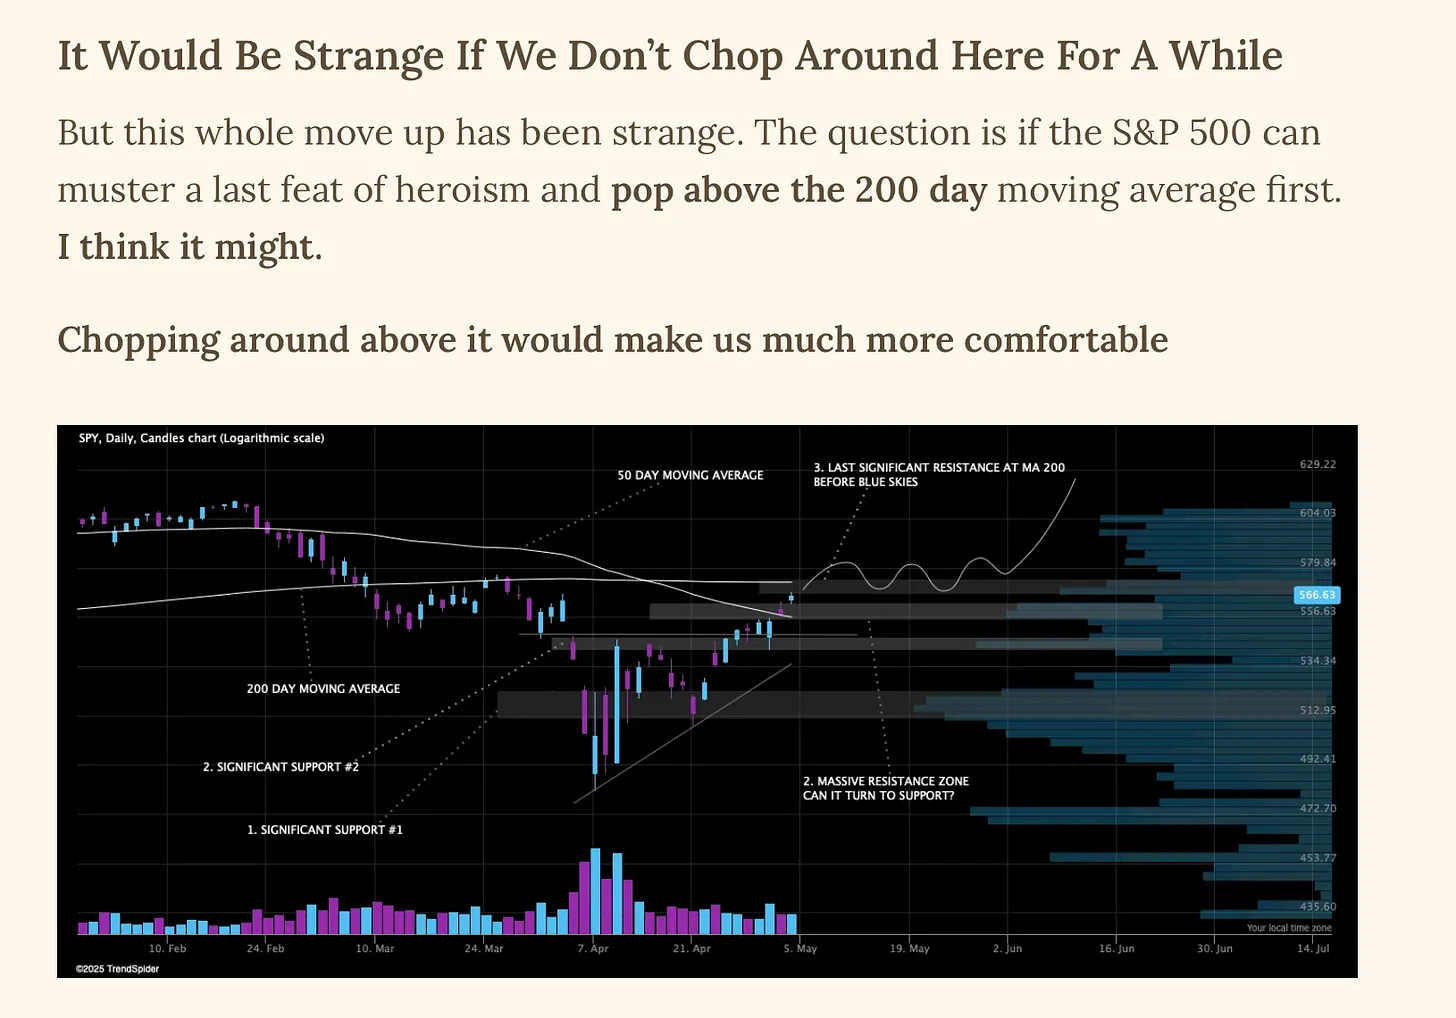
But So Far I Have Not Been Comfortable At All
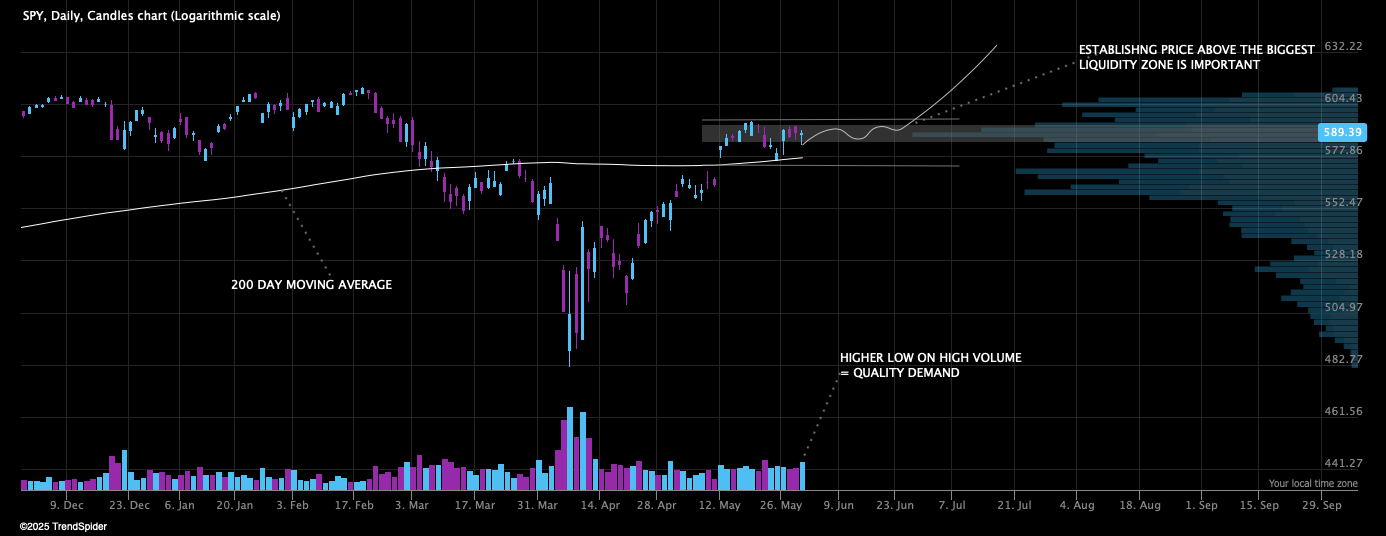
But maybe we are getting there — we got a great higher low on significant volume
It is expected that price will oscillate here at the biggest liquidity zone
Oscillating, equilibrates supply and demand, until we reach a tipping point and get asymmetric demand or supply — which triggers the next big move
I believe, based on the chart, that the bias is still clearly bullish
We are also above all major moving averages and the slope of those averages are rising — bullish until proven otherwise
We did not close the gap and we put in a higher low — we should probably not ask for more during a week from the bulls
What will be an even more significant bullish clue, is that we establish price above the biggest liquidity zone at 5900 and put in a higher high
And for an uncomplicated bullish thesis — Fridays low should hold
The Underlying Market Is Oscillating As Well
Which we have noticed in the action of individual stocks. We are largely going nowhere since our thrust up.
The major indices are oscillating and so are breadth. In a very bullish scenario we would see breadth improving while the major indices are pausing.
In a very bearish scenario we would see breadth deteriorating while the major indices are pausing.
We are seeing neither, breadth is mostly pausing, meaning the underlying market is in indecision as well.
The average stock is still in a bear market with only 40% of stocks in Nasdaq Composite above the 200 day moving average

We are waiting for a followthrough breadth thrust propelling more stocks above the 200 day moving average, and confirming the overall reversal.
Hopefully this is the start of that thrust.
MAGS Still Weak
And I will continue to be concerned until MAGS shape up and reclaim their longterm channel.
Because MAGS is more than 1/3 of the S&P 500, and the implications of a weak MAGS, will have an effect on the overall sentiment in stocks.

VIX Put In A Higher Low And Hedgers Re-Positioned
Its not much to the eye, but we need to monitor this. It closed under 20 on Friday, but it is still lingering at an elevated reading.

What is more concerning is that smart money hedgers are no longer net short VIX — instead they are net long VIX.
Meaning most VIX hedgers believe VIX will increase.
In February, while the major indices were going sideways, VIX hedgers became aggressively long. They were ahead of the market anticipating the pullback.
(Source: SentimenTrader.com)
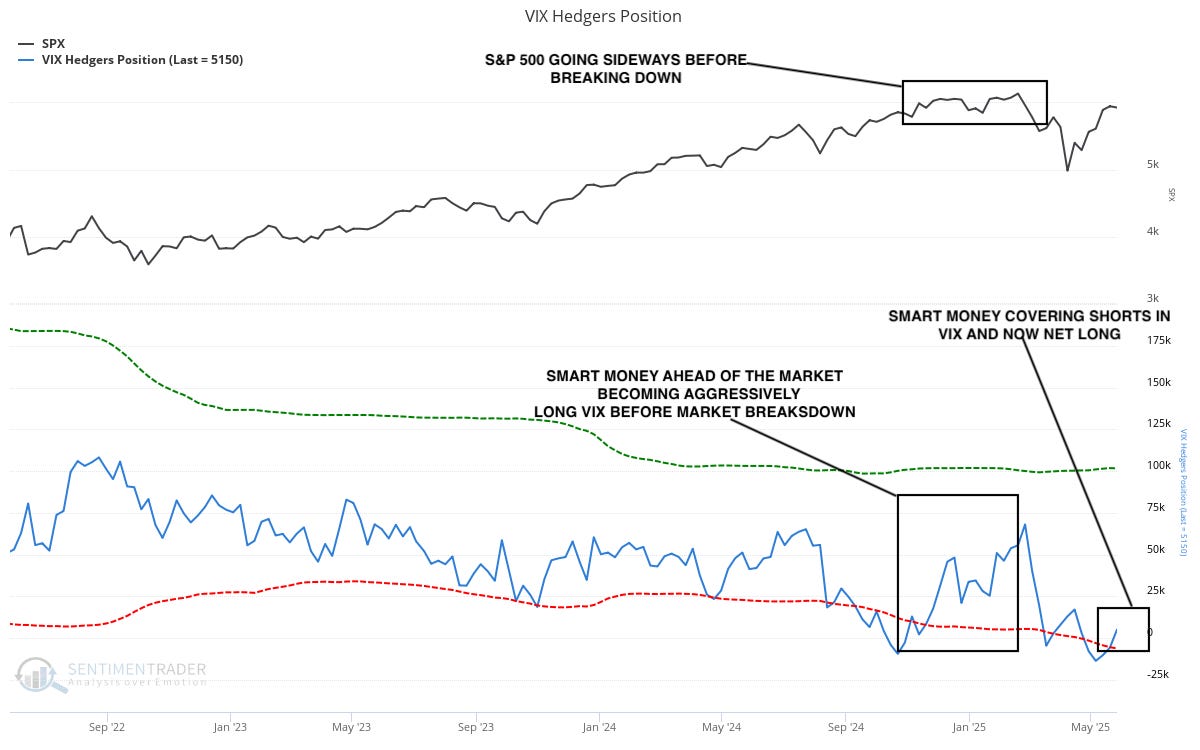
So far I don’t view this as a red flag since, they are coming from a net short position and are modestly net long.
What we will watch for every week is if they signal aggressiveness in their long positioning — while the market is still chopping sideways or advancing.
That would cause us to be very cautious, since smart money usually are ahead of the market and knows more than us.
The Market Sentiment Cycle Tells The Tale
The sentiment cycle indicator is built on data from 1928 and it is still gathering data.
It compares the behavior of stocks in past market cycles with the current price action and environment. And then categorizes the environment in enthusiasm, panic, discouragement and returning confidence.
We have no returning confidence but neither any panic at the moment.
What we have is a lack of enthusiasm and increasing discouragement.
What we see in individual stocks historically, in periods of increasing discouragement — is a choppy market.
And it aligns with what we are seeing and what I believe we will continue to see during 2025. A choppy market where gains are short-lived and hard to capture.
(Source: SentimenTrader.com)

During the 2022 bear market, we saw a normal reaction as we bottomed.
But everybody must have noticed that we live in a highly abnormal market at the moment. This is a bigger picture indicator and nothing that affects our short term positioning.
But I believe further down the road, we might be in for a wild ride and a bigger period of uncertainty.
NYSE New Highs Tells The Same Tale
And verifies the choppy environment we are living in.
A down trend is easy, an uptrend easier.
A sideways market is the worst environment for a swing trader. Since the gains are hard to capture, and no meaningful advance is made — while nothing breaks down either.
This chart shows the percent of stocks in the New York Stock Exchange trading at 52 week highs.
(Source: SentimenTrader.com)

And this is my personal observation as well, when studying individual leading stocks. We see no significant breakdowns, but we also see no meaningful sustained advances away from multi month bases into new highs— yet.
The market is in clear indecision, but maybe Fridays price action can be the start of something better.
Individual Stocks Are Heavily Shorted
And the shorts within the Nasdaq are not only not being covered — the shorting is picking up the pace and is at an all time high.
Since shorting activity is highly seasonal — this chart is adjusted for seasonality effects.
The heavy and increasing short interest might fuel the advance in the short term, to further squeeze the shorts.
(Source: SentimenTrader.com)

IPOs Are Behaving Well
Which is good — as a risk appetite sentiment gauge.
As I have showed you before, IPOs flashed some warning signs before we turned down in 2022.
They are not breaking down or flashing any red flags so far.
Renaissance IPO ETF

Seasonality Matters
Most of the years, but this year is not normal so we will see about that.
But June is usually a bit wild.

Gold Wanting To Push Higher And Bitcoin Breaking Down
Well bitcoin isn’t really breaking down that hard, and gold haven’t pushed out yet. But this is something we need to monitor going forward since both these signal might be negative for stocks.
Bitcoin

Gold

The longterm theme play for gold is very intact. And I expect this consolidation to resolve to the upside, but I am not so sure it will happen this soon.
Watch Cybersecurity Next Week
The group signaling very clearly that they want to push into new highs.
Cybersecurity ETF — CIBR

The Bottomline
This is a stock pickers market — individual groups and themes make significant moves, but very few moves into new highs are sticking and continuing
Since we are above all major moving averages we should have a bullish bias, since price always is the best indicator
But I still believe that this is not a 100% portfolio exposure environment just yet — we need some followthrough on the upside. And we need stocks like PLTR, making new highs and advancing swiftly, for us to gain confidence
Friday we saw a great recovery on volume in tech/growth stocks setting the table for a push up to new highs next week — Let’s see if the signal sticks
We see no red flags in smart money positioning or sentiment indicators showing clues of an impending major decline — it might come anyway but the bias is still up
A shakeout under Fridays low would be normal as well, but dipping into the gap again would be abnormal and a major red flag for us
Breadth, sentiment, smart money positioning and most other interesting indicators are in the middle and neutral — further verifying the choppy sideways market we are in
This environment is difficult and needs aggressive profit taking and entries in only the absolute best setups
I still recommend shorting up your timeframe until we get better broad market participation up
Lastly we will watch the leaders — because they are our best indicator of the coming direction, lets hope PLTR was the first real sign
Hope this helps and thank you for reading, if you liked it feel free to share it.
Charts courtesy of SentimenTrader.com
https://sentimentrader.com/subscribe-newsletter
Charts courtesy of equityclock.com
Charts courtesy of TradingView
Charts courtesy of TrendSpider
Disclaimer:The Setup Factory is not licensed to give any investment advice. The content provided in this email and from this Substack-account is my own thoughts and ideas about the stock market. It is for educational purposes only and should not be considered as any form of investment advice. Do not invest in any stock based solely on the information provided here. Trading stocks is highly speculative and involves a high degree of risk of loss. You could lose some or all of your money. You should conduct your own research and due diligence in any investment you do, to verify any information provided.