


Increasing Complacency

The TSF - Focus Stocks Page Will Be Updated Tonight
For all paid subscribers —with the five best setups and opportunities going into this week, complete with methods on how to catch them.

Last Week I Told You
You can read last weeks market analysis for free, now open for all to read:

And We Got A Swift Get Away Into New ATHs

We are drifting nicely up and away from the previous ATH level
The rate of ascent is accelerating up, which is something we need to monitor closely
We are stretched on the upside and overbought — what would be logical is a backtest of the breakout level
But as we know, the market is not logical, and we can continue drifting up, far longer that anyone expects.
Testing the first significant support zone would be normal and likely, but falling into the danger zone would warrant extreme caution — because it opens up a scenario of a double top.
Today our main focus will be searching for signs of worry, signs of an impending aggressive decline. So we can be positioned correctly in the market — and avoid participating in ugly surprises.
Today’s Agenda
Breadth observations
Being overbought is not a sell signal
IPOs
MAGS
Small caps
Retail getting carried away, and smart money selling into strength
Buying exhaustion
Hedge funds not convinced
VIX hedgers changed character
The best way to know the direction is to study retail
Complacency
TSF — community trade plan
Now it’s more important than ever, to stay aligned with the market. Being overexposed at the wrong time can be costly.
Since a pullback from overbought levels can get nasty.
Lets dive under the hood looking for clues of where we stand and might be heading.
Finally A Broadening Of The Rally
With a real breadth thrust in longterm breadth, confirming the recent moves in the major indices.
This is exactly what we want to see, and what I have said has been lacking in the advance, until now.
Since longterm breadth is improving from low levels, this can be very bullish, since there are many stocks that still are turning up.
And they can act as fuel, advancing the broad market further.
% Of Stocks Above The 200 Day Moving Average With The S&P 500

This is the ideal action to see, when gaining confidence that this is the start of a new bull market.
After this breadth thrust up, we will start paying more attention to when we arrive at levels of overbought, to align us correctly in the market.
We still have room to run if we look at the longer perspective.
But In The Medium Term Perspective We Are Severely Overbought
Which actually is normal, when the market rallies and breadth broadens. We usually see the same thing at significant turning points, like for example as we bottommed after the 2022 bear market.

When we are short and medium term overbought, like we are, you should be careful and risk conscious. Because the market usually at least pauses or declines. And since most stocks follow the movements of the major indices, this is something you should be aware of.
This does not mean that we must crash straight down, just because we are overbought.
We are overbought because the market is strong, that is not a sell signal.
But being too aggressive when we are unnaturally overbought, can turn into unpleasant reversals in growth stocks.
A decline or pause above the breakout level in the major indices, seems likely in the short term, since we are overbought and need to rest.
A Brief Look At IPOs — Still Signaling Risk On
So far IPOs are still signaling a risk on environment in play.

They are still however underperforming the market, after they outperformed hard on the first thrust up.
If they can gain traction and start outperforming again, and break out to new ATH — that would be a very encouraging risk on sign.
MAGS Almost Convincing Me
Just a last push in please, and confirm that your longterm uptrend is intact.

The market needs MAGS, for us to advance in a sustainable way.
And Small Caps Reclaiming The 200 Day
A big move, and further evidence for us to be confident in the emerging bull market.

Because small caps lead the advance, and lead the decline.
We Should Have More Gas In The Tank In A Longer Perspective
When looking at the amount of buying climaxes in the Nasdaq 100, we see no clear evidence of significant buying exhaustion behavior.
This chart shows the number of stocks in the Nasdaq 100, making a new 52 week high, but closing below that level during the same week.
Signaling a buying exhaustion and climax, with selling pressure coming in immediately after a new ATH.
When many stocks exhibit this behavior, it is usually a sign of a significant market top.
(Source: SentimenTrader.com)

As you can see, before the 2022 bear market we saw clear signals of the un-health of the market. With extremely high levels of buying climaxes and exhaustions, signaling that the end of the bull market might be approaching.
In late February this year, we saw some minor signs of buying exhaustion, but since this bear market was a man made crisis — I believe the dynamics of that top was different.
As of now, we are not seeing elevated levels of buying climaxes, that we usually see at a significant market top.
Even though the moves seem excessive, the new ATHs are held and we are not seeing buying exhaustion.
What we will monitor as we go along, is signs of repeated exhaustion like we clearly saw before the 2022 bear market.
If we study the broader S&P 500, we see the same observations as in the Nasdaq 100 — no signs of buying exhaustions yet.
All This Is Great — But The Level Of Complacency Is Increasing Fast
Retail Getting Carried Away And Smart Money Selling Into Strength
Together with the level of overbought, the widening spread between smart and dumb money confidence — favors a short term pullback.
That would be much needed, to make the advance sustainable.
The spread between dumb money and smart money confidence is widening at an aggressive pace, which is a signal of an elevated risk in the market — in the short term.
(Source: SentimenTrader.com)

But smart money is still not that bearish, which can make the spread continue to widen for some weeks. But whenever we have a significant widening spread in smart and dumb money confidence, you should look for other clues of worry in the market.
Hedge Funds Still Skeptical And Money Managers All In
I like to track the positioning of hedge funds to equities. Last month we talked about the fact that, hedge funds does not have a high positioning into equities. Which can be interpreted as bullish, because that means there is a large potential capital flow that can flow into equities.
But what we are seeing now, is that hedge funds are continuing to sell this move into ATH, which is concerning if it continues.
At the same time NAAIM exposure, a survey of the positioning of active money managers, are all in stocks. Exposure long equities has skyrocketed to 99.3% long.
When they are overly optimistic, we usually turn down eventually.
(Source: SentimenTrader.com)

They can however become leveraged long above 100%, we will likely arrive there soon…
VIX Low But VIX Hedgers Increasing Their Bets On VIX Going Higher

I often talk about the importance of a low VIX under 20, it favors the bullish thesis. And it is good for our trend following strategies.
VIX is staying low and calm, but when I check the VIX hedgers positioning — they have significantly increased their bets on an elevation in VIX.
The levels of smart money long VIX, is still not at seriously alarming levels, but something to keep watching.
Small Trader Put Buying
Since retail are proven poor market timers, they are great contrarian indicators. They are steadily becoming less and less bearish.
This chart shows the put buying of a small speculator. As you can see they were max short as we bottomed, and least short before we crashed in February — that’s usually how it goes, and they are therefore great contrarian bets of the coming direction.
(Source: SentimenTrader.com)
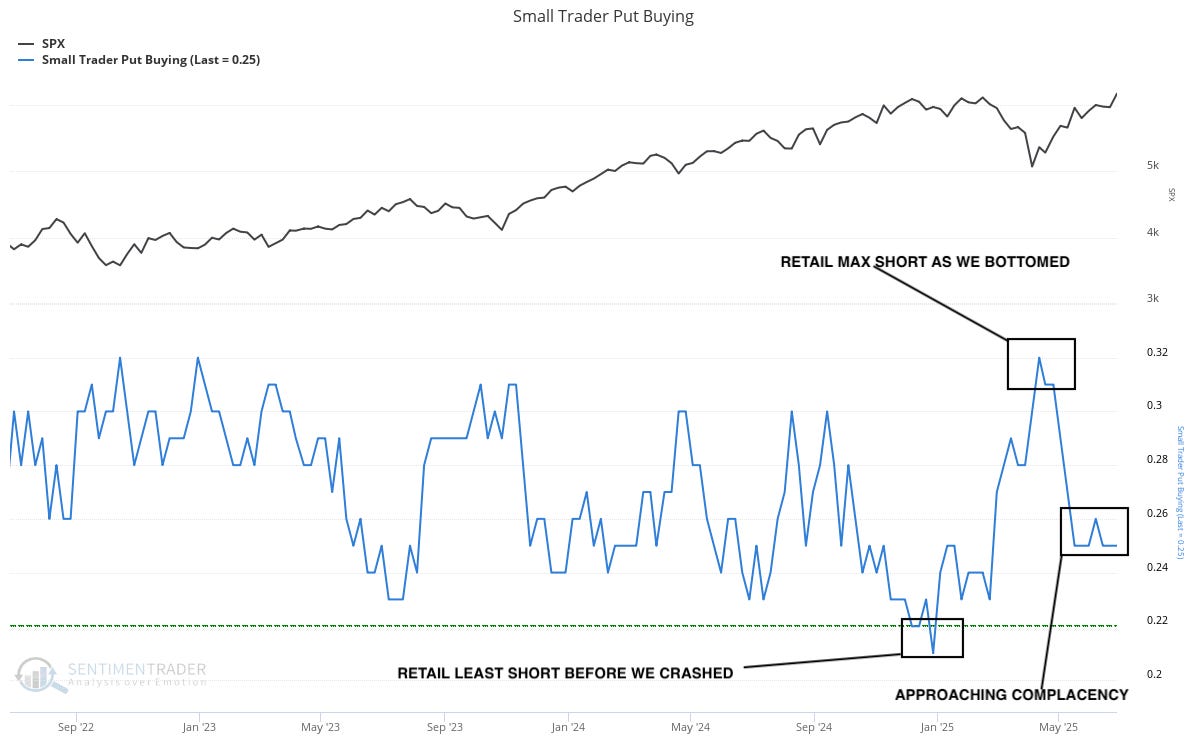
They are not at an extreme, more bullish than ever, but we are getting there. Keeping an eye on this, because their track record is practically flawless.
Complacency
When the market becomes overly bullish, it becomes complacent. Meaning the investor confidence in a further advance, becomes detached from the actual risks in the market.
The perceived risks are greatly underestimated, while the actual risks are still present.
What usually happens when complacency peaks, is a swift decline.
The timing is important here, because a complacent market can stay complacent. And an overbought market can stay overbought.
We See Clear Signs Of A Strong Market
Verified by breadth
A/D-line
Price of the major indices
McClellan Oscillator and other momentum indicators
Risk on and sentiment indicators
As well as the price action of individual leading stocks
We also see a proliferation of setups and a broadening of groups rallying
All this is good and sweet.
But We See An Increasing Level Complacency
Equity put/call very low
NAAIM and AAII bulls soon max optimistic
Low levels of hedging in the market
Widening smart money/dumb money confidence
The most dangerous factor of which is the dramatically decreasing hedging of the market.
A poorly hedged market, is a dangerous market vulnerable for swift pullbacks.
So How Do We Handle An Overbought And Increasingly Complacent Market?
How I handle this is purely focusing on not chasing stocks, when the major indices are overbought and severely extended. Because the risk/reward will be skewed to the downside.
I also still do not believe this is a 100% portfolio environment market just yet.
As I lay the puzzle my personal feeling, is that we might stay overbought and complacent for a little more. We will then get a catalyst, perhaps the start of the earnings season or some tariff news, that will bring us back to reality by backtesting the breakout level.
This is all speculation, but I recommend being careful with putting on heavy new exposure while we are overbought. Focus on handling your existing trades, and buying at correct buy points and don’t chase stocks.
The longer we stay overbought, the more likely it is that we will cool off — that always happens. By chasing stocks and entering late, your entry will be very vulnerable if we turn down.
We also have very few bases forming in leading stocks. Since leading stocks are ahead of the market, they will start to base first — we are approaching a point where a consolidation will be necessary, to fuel further advance in the best stocks.
The Bottomline
We are in a confirmed strong uptrend, above all significant moving averages — we are in a buy the dip environment until we violate significant levels
Leading stocks are acting good, and the rally is broadening
But we are overbought, and that is something you must consider when trading
We don’t have to decline, we can pause or sector rotate to cool off
Focus on handling your trades, and don’t chase stocks when we are overbought
I expect us to stay complacent for longer, and it will be very important for us to notice when we approach peak complacency — because when we do we usually pull back hard.
It does not feel as if we are there yet
Do not relax, stay nimble and focus on the best leading stocks in the best industry groups — because those are the stocks that are most likely to withstand the inevitable pullback that will come in the future
Having said that, we can drift up carelessly far longer than you would expect, and we will calmly follow the trend until it ends.
Hope this helps and thank you for reading, if you liked it feel free to share it.
Charts courtesy of SentimenTrader.com
https://sentimentrader.com/subscribe-newsletter
Charts courtesy of TradingView
Charts courtesy of TrendSpider
Disclaimer:The Setup Factory is not licensed to give any investment advice. The content provided in this email and from this Substack-account is my own thoughts and ideas about the stock market. It is for educational purposes only and should not be considered as any form of investment advice. Do not invest in any stock based solely on the information provided here. Trading stocks is highly speculative and involves a high degree of risk of loss. You could lose some or all of your money. You should conduct your own research and due diligence in any investment you do, to verify any information provided.