

Don't Panic Yet

What TSF Is:
A comprehensive swingtrading resource that saves you time, analyzes the market and searches for interesting opportunities and setups in stocks
A trading educational resource that is aimed to help you build a methodology, process and risk management & execution framework to be able to trade according to good trading principles
A community with a private Discord
TSF - Analytics platform
What TSF Is Not:
A trade alert service. I share all of my own trades, but those are my own personal trades and thoughts that I journal. They are never a recommendation to buy or sell anything, nor any type of financial advice
Nor are the setups a recommendation to buy or sell anything, nor any type of financial advice. Every setup needs to trigger to become valid, I only share my own views on the setups and the stocks I talk about.
The TSF - Focus Stocks Will Be Sent Out Tonight
To all paid subscribers — with the best setups and opportunities going into this week, complete with methods on how to catch them.

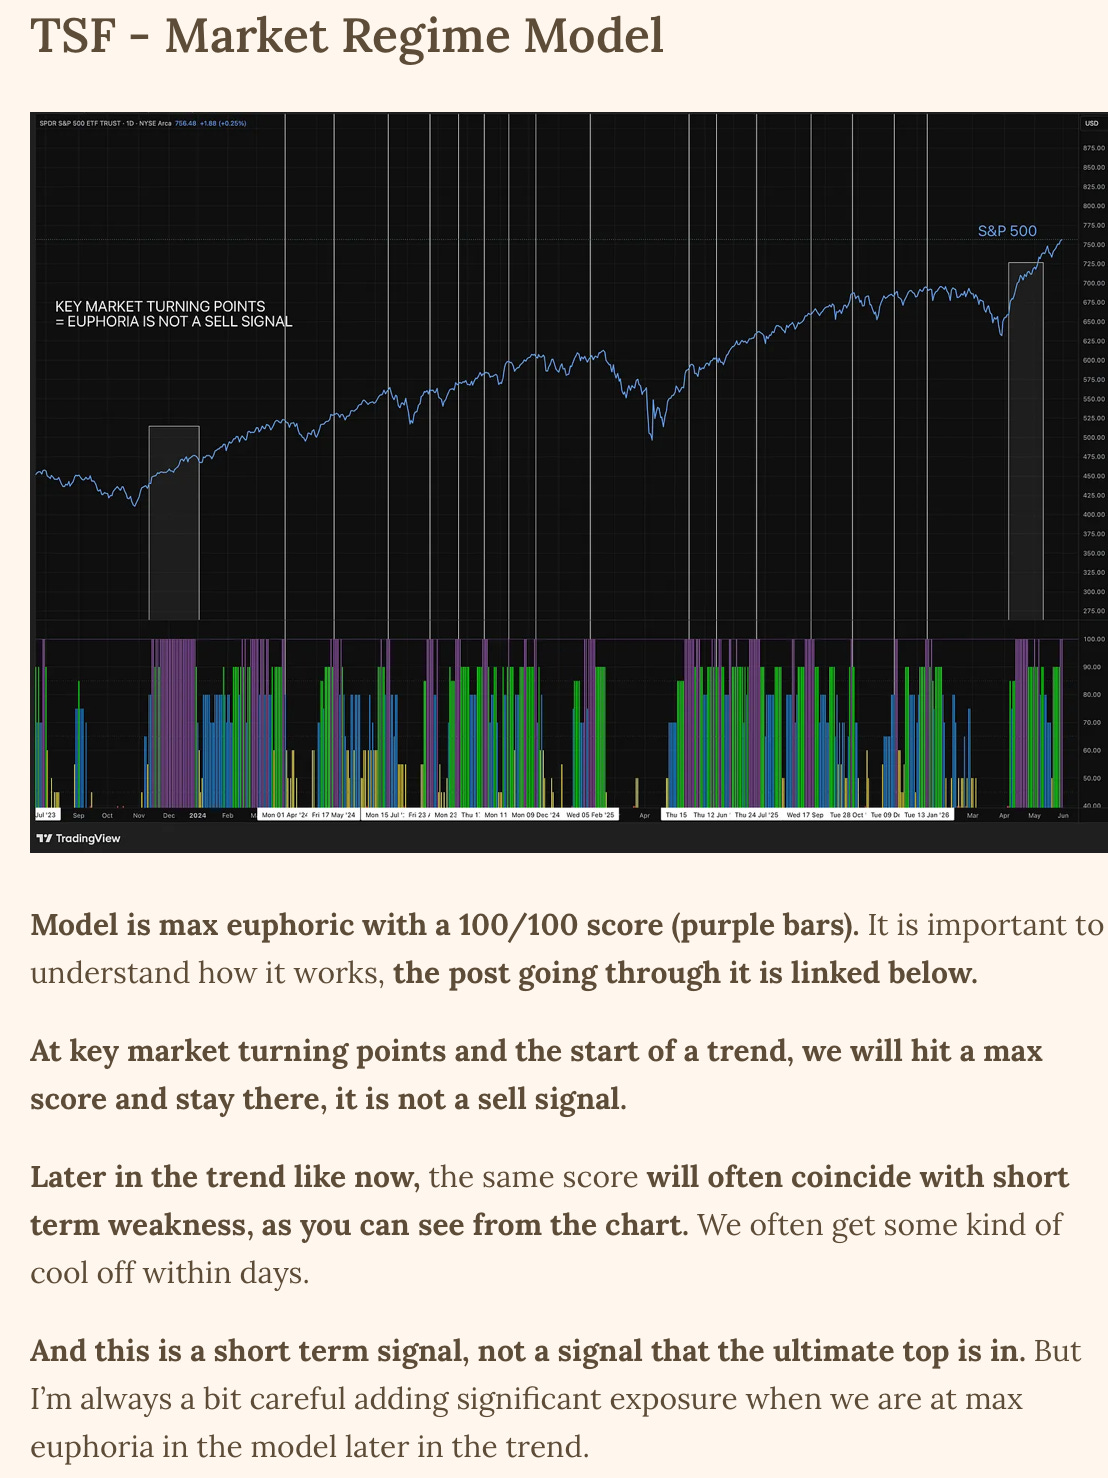
I Am Yet To See A Top Not Captured By Our TSF - Market Regime Model
One of the most under appreciated tools that we have access to at TSF. I have developed a multivariable proprietary model, backtested it on 20 years of data, and we use it to be aligned with the market cycle.
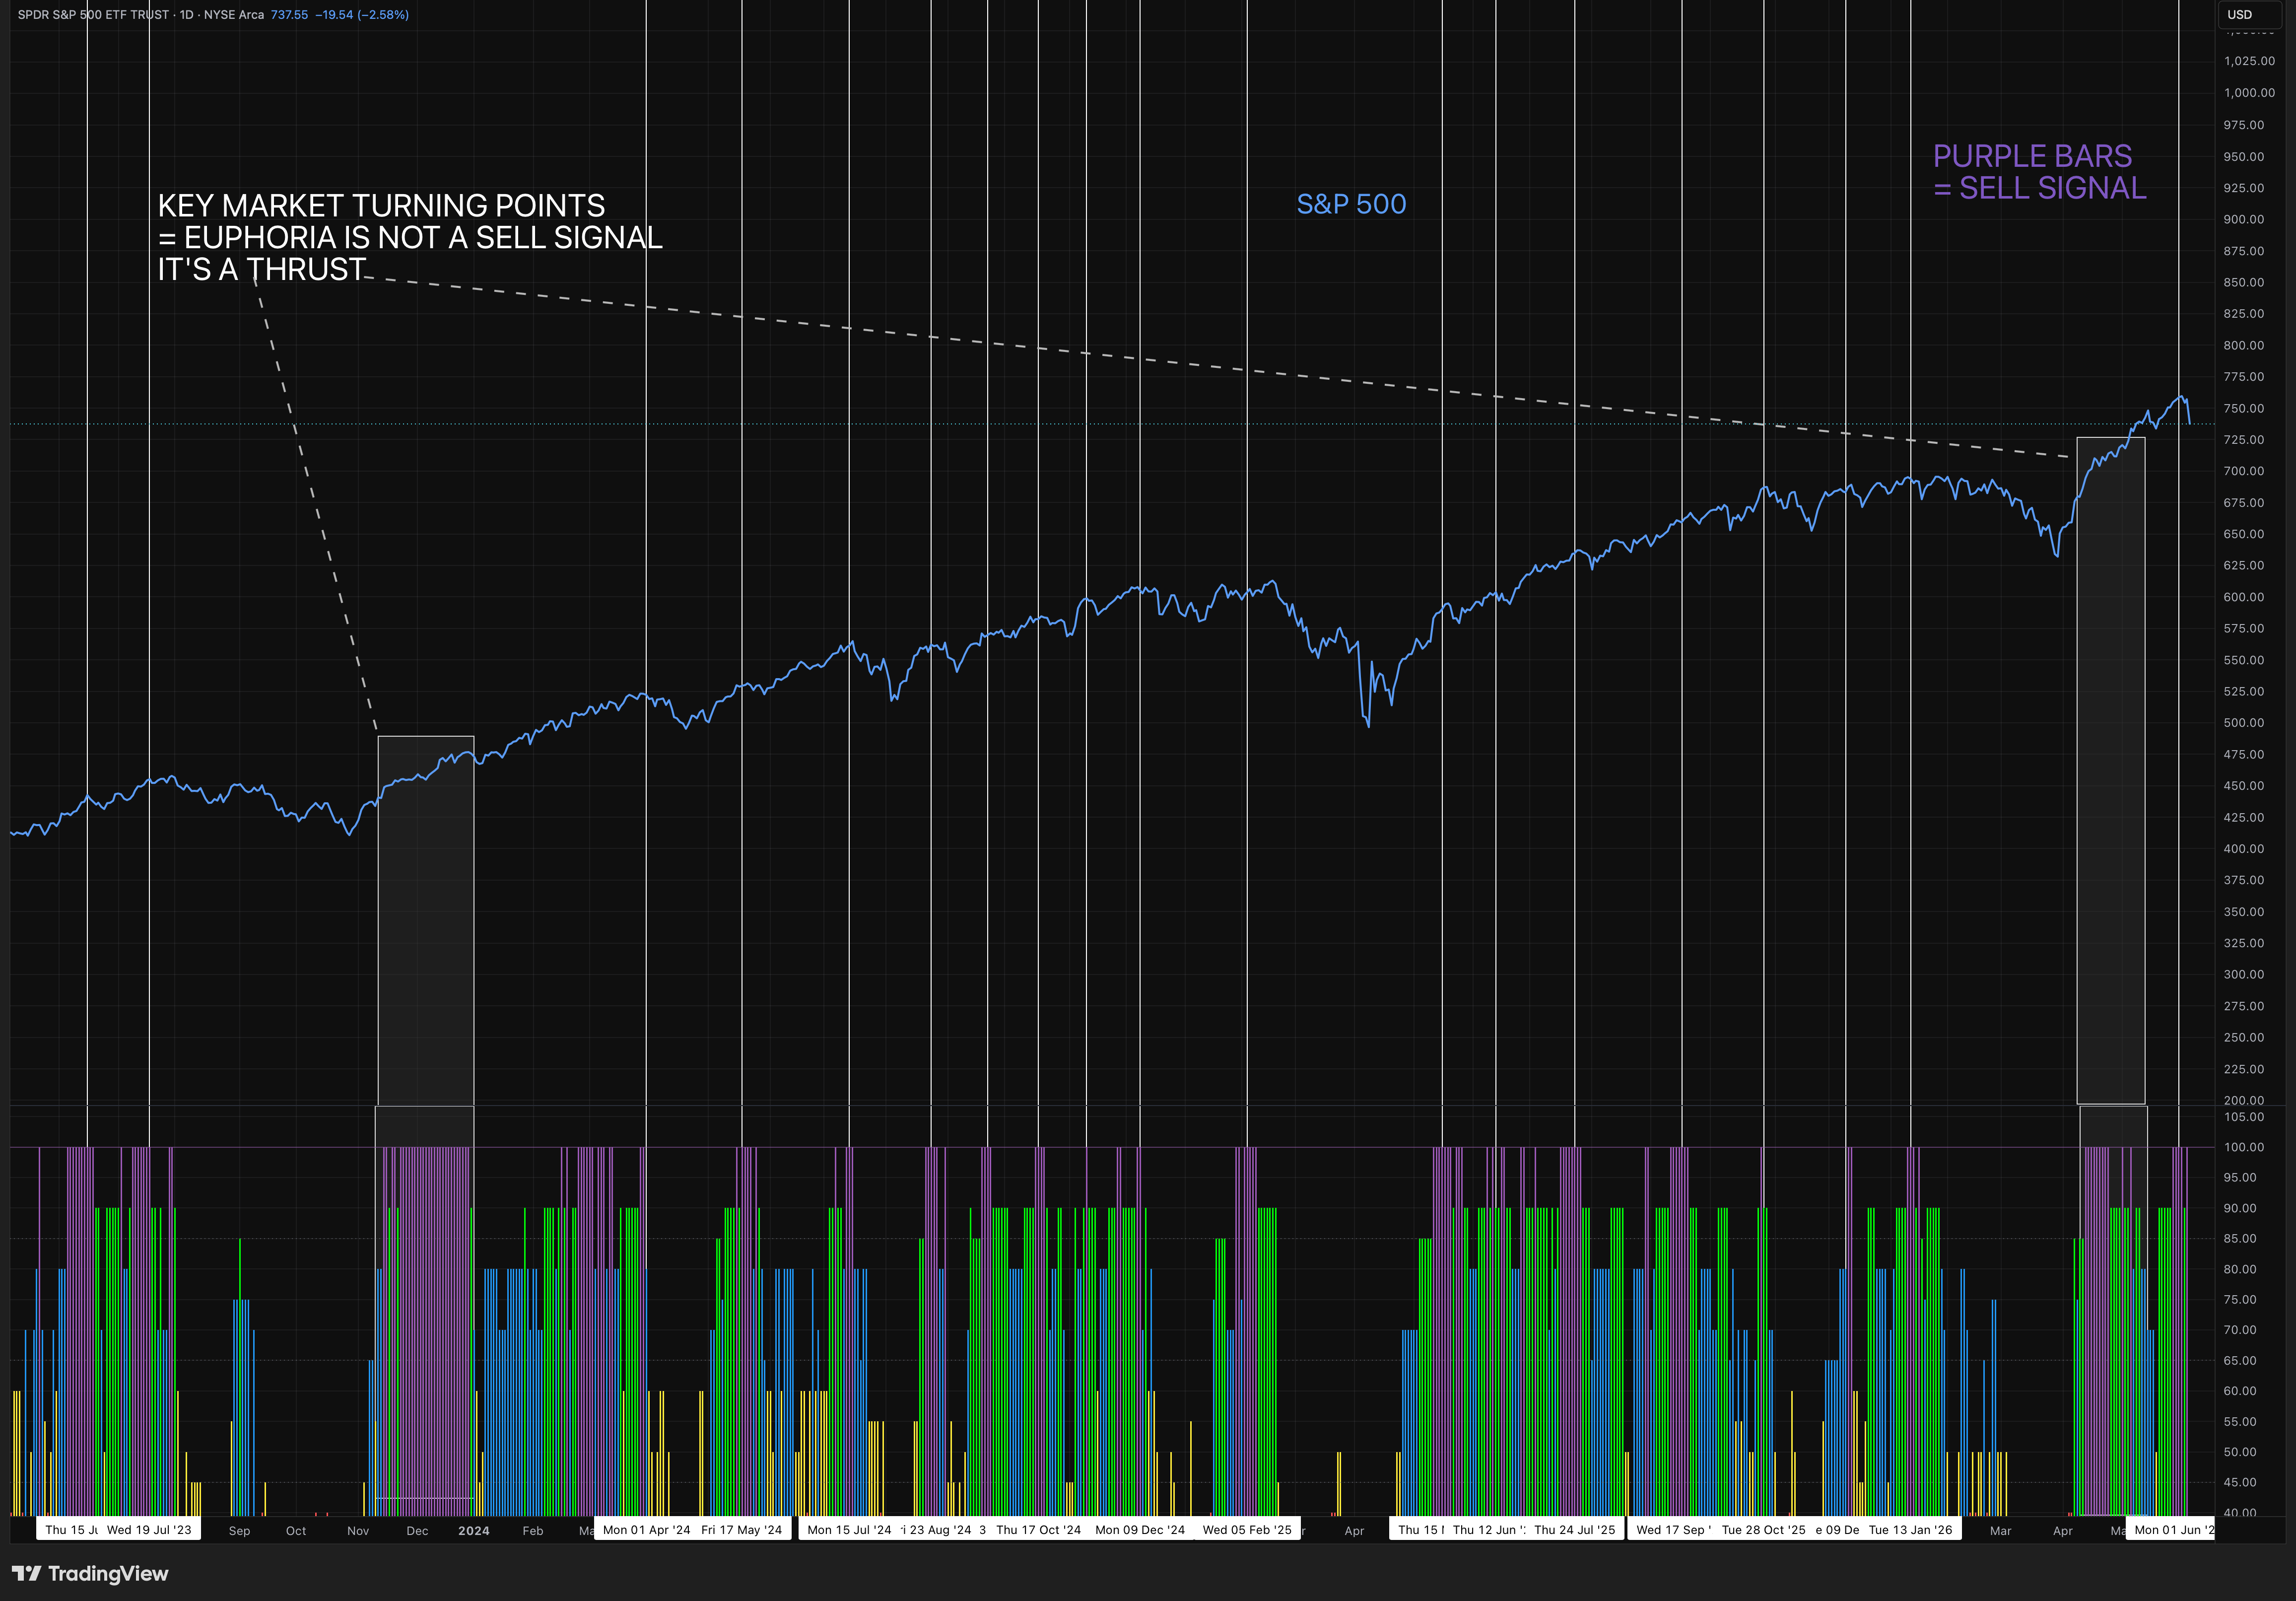
When we are late in the trend and it hits a max euphoric score — we top within days. Doesn’t mean an ultimate top, but we decline short term.
When we are early in the trend, that same score is not a sell signal, it’s a thrust.
And we have been hitting back to back max euphoric scores as I have highlighted for you, here is what I showed you in last Sunday’s market analysis.
No Model Is Perfect
I trust no model blindly, but during the last couple of years, this has worked incredibly well.
The score is updated daily on TSF - Analytics, and you can read about the backtests in this post:

Lets Start With Some Observations Shared Ahead Of Friday’s Historic One Day Dump
If you read TSF, you can not have missed the vulnerable state in which the market has been in lately — we were expecting weakness soon. That doesn’t mean we sit in cash, but it means we have to be mindful of new exposure and new risk, and sell into strength in a vulnerable market.
And last week I told you to prepare for the next phase before it arrives.

Because We Were Set Up For A Dump
And I laid out what was causing the vulnerability in the market structure in last weeks market analysis.

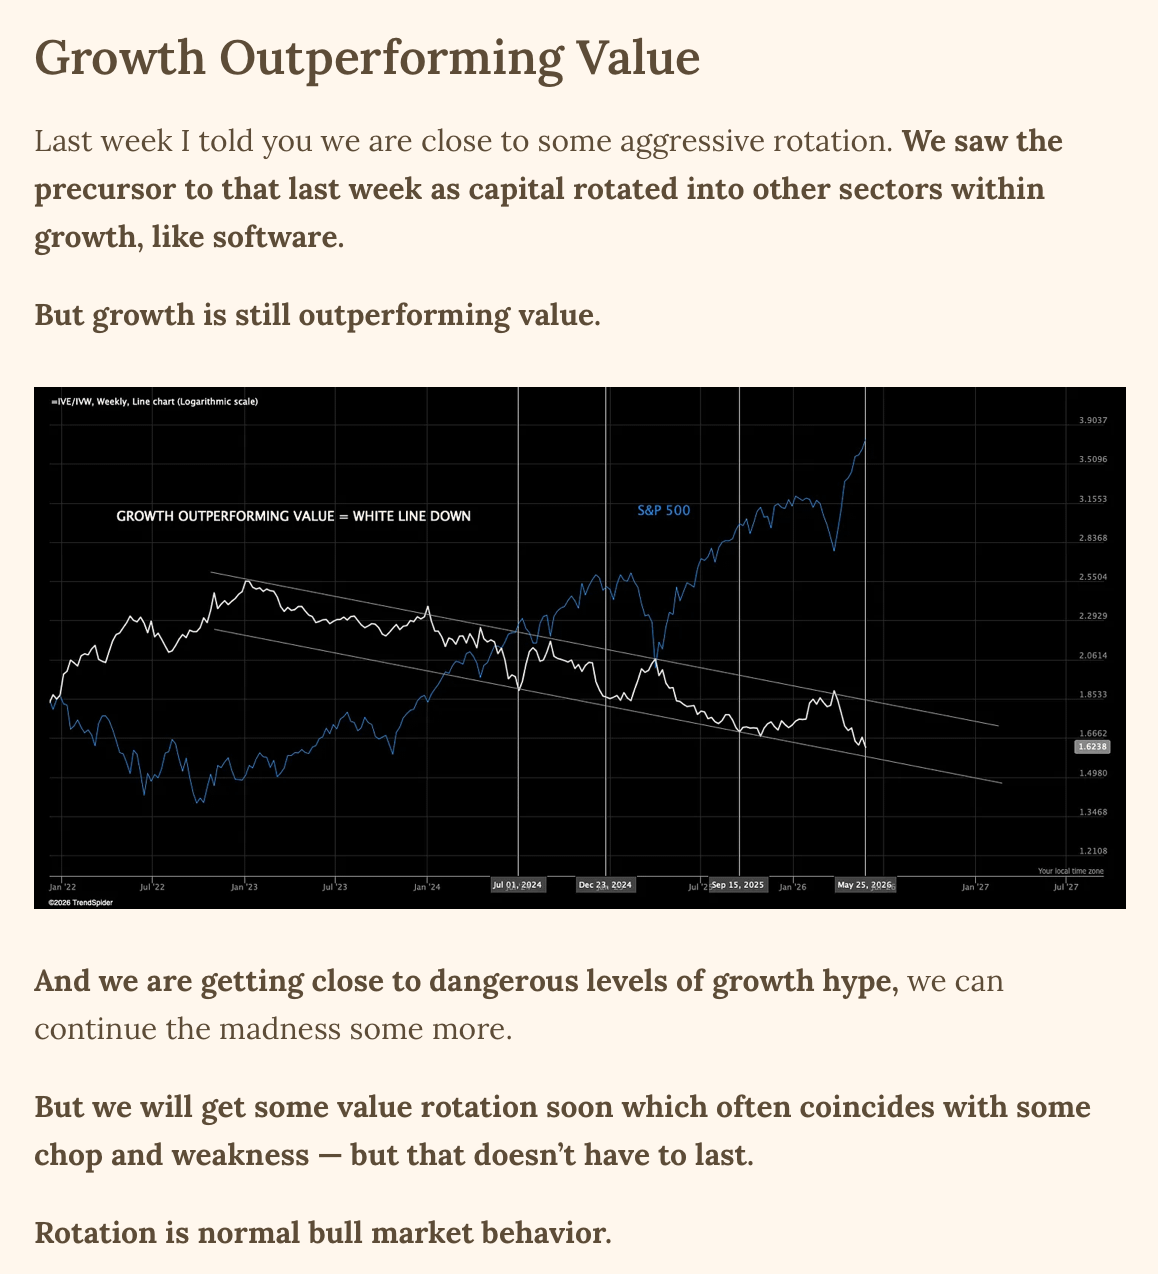
1. When Growth Outperforms Value Excessively We Are Very Close To A Decline
2. When Realized Vol Compresses This Much It’s A Matter Of Time Before We Flush
3. When Both Dispersion And Correlation Are At Extremes
You have a stock pickers paradise, but history tells us it doesn’t last and significant weakness is around the corner.
4. Historic Complacency In Equity Put/Call
5. We Backtested The Retail Hype
When retail are excessively euphoric, we dump — it never fails.
The Signs Were There — But Still Nobody Expected This
A major technical breakdown?
If we zoom out — not yet. And I am personally feeling pretty calm short term, while most seem absolutely sure the doom is here.
But my opinions do not affect my execution — I am a trend follower and a student of price action, what happens from here is what decides my exposure — not what I believe will happen.
But here are some good advice for everyone, whether you are a part of the 400+ TSF members or not.
You should do a couple of things from today and onwards if you want to ensure you have a good year.
Because your actions from now will likely determine the outcome of this year for you.
First, block out the noise, there are so many opinions based on thin air after moves like this, the louder they are the more wrong they often are.
Bears that missed the whole move up. cheering despite being left behind, and hopeless bulls telling you buy without thinking denying the change.
If you had a plan going into this, sold into strength, trailed deep in the money trades and didn’t overtrade late in the cycle — enforce that, be happy and proud. That is difficult and that WILL make you survive and become a great trader
If you did all of the above and still lost a lot — that is the price you pay for gains, you can’t have both worlds. If you want to trail stocks for bigger moves, you will give back a big chunk when that trail fails. Is your account higher than two months ago or not? If yes, you made progress — that is what matters. Study your trades and tweak what went wrong.
If you didn’t have a plan, lost all gains and overtraded late in the cycle, don’t beat yourself up, be kind to yourself. We are greedy by nature, we all make mistakes — it is one of the core instincts we fight during our entire trading career.
But if everything went horribly wrong for you — remember this feeling, canalize it into building a process, strategy and risk management framework that will protect you from feeling this way again.
Don’t deny the pain, embrace it and funnel it into something productive.
Nobody improves without effort, tools and guidance. That is why I have built our trading education archive — everything you need is there for you to dive into, to understand how to force yourself into good decisions.
But in the end, without internal honesty and understanding your shortcomings and weaknesses — nobody will improve and the boom bust trading cycle will continue and can continue for years.
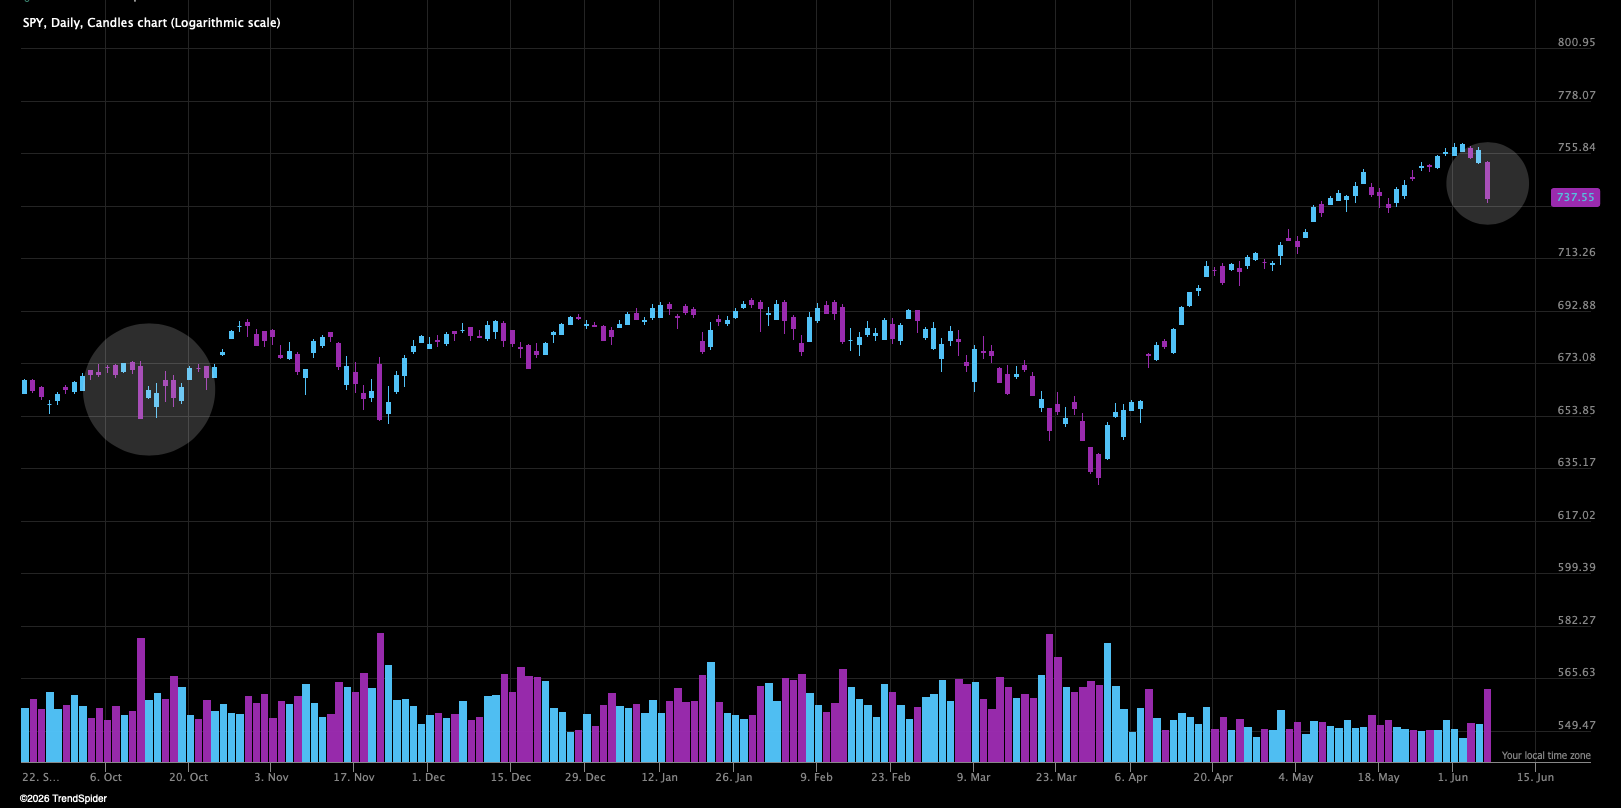
Regardless if you are a hopeless bull or a stubborn bear — when moves like these occur, they leave cracks in the structure. Cracks that may take time to mend — the regime might have changed. Pay attention to this, not business as usual yet.
That does not have to translate into a bear market or a swift decline — but it can mean stocks may behave differently, just like they did after the 10/10 dump highlighted above. And if you trade in a careless way from here, you will likely bleed capital.
Understand that your performance is directly tied to the market conditions — your skills are often completely irrelevant in a booming bull.
The edge is in understanding this — so you won’t become overconfident and a boom and bust trader. Everyone can make gains in a bull — very few can keep them.
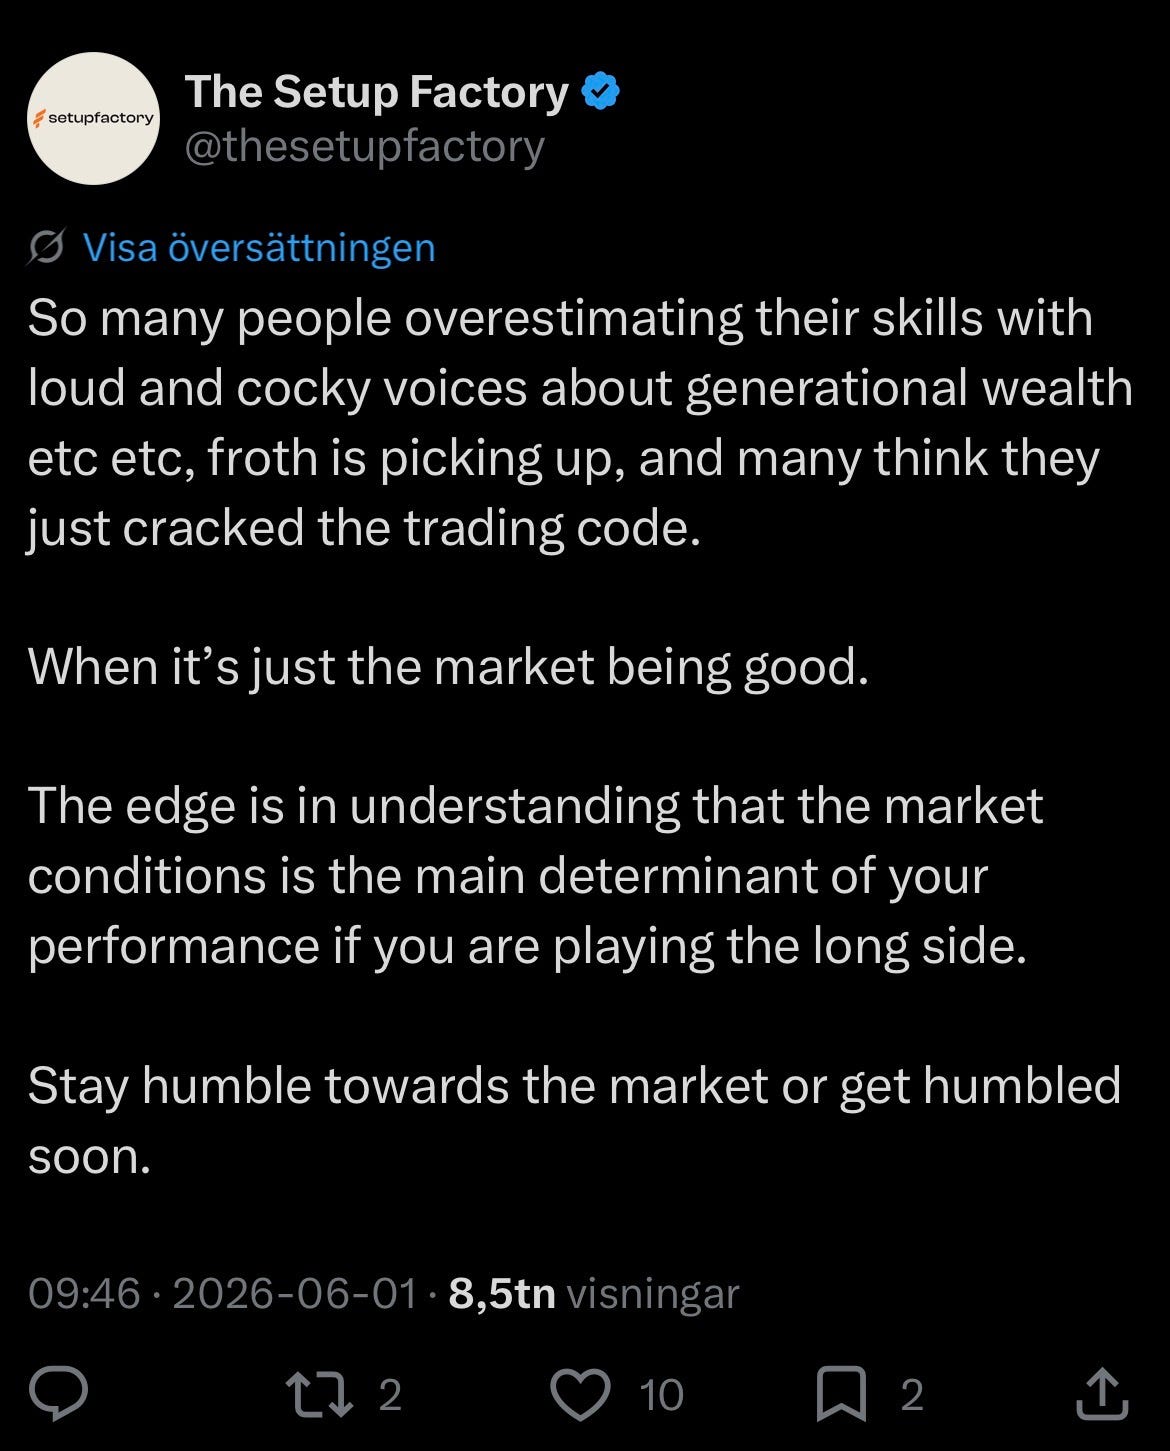
And the sentiment on X is the best indicator for retail — Stay humble or you will always get humbled. Check the date stamp above.
The market may want higher — but the market is telling you to put on the breaks for a second — listen.
Don’t fight the market, the market is the market — we bend with it, we don’t force our hopes, goals and dreams upon it.
The market does not care what you want, use the market when it allows you to use it to reach your goals.
Stay sharp, stay focused — great opportunities will come out of this, but don’t be too eager.
Rant over, today I did the work — lets dissect the market conditions to see where we might be heading.
This is one incredibly comprehensive analysis, grab a coffee and enjoy the read.
Explore TSF - Analytics
Structure Is Far From Broken — S&P 500
This was a significant move no doubt, but we were very extended and we are paying the price for that.
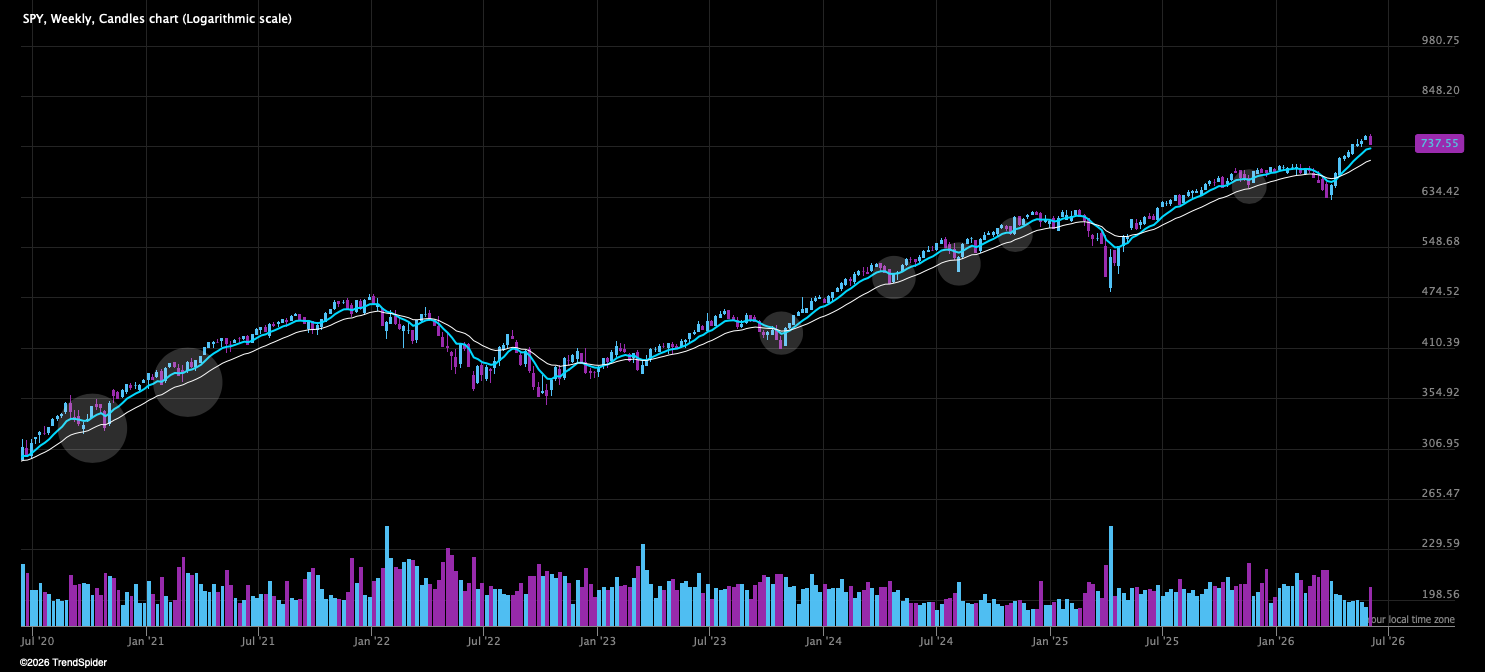
But structure is far from broken yet when we zoom out, we haven’t even touched the weekly EMA 8 (blue line) which is regularly violated in strong uptrends, price can even live below it for a week or two.
The line in the sand for me on weekly charts is the weekly EMA 21 white line), when it is violated, we correct significantly most often, and the ugliest moves come after that.
That is far down. Structure is far from broken, caution is warranted yes — but don’t jump to conclusions just yet.
Zooming Out Some More — Are We Really Surprised?
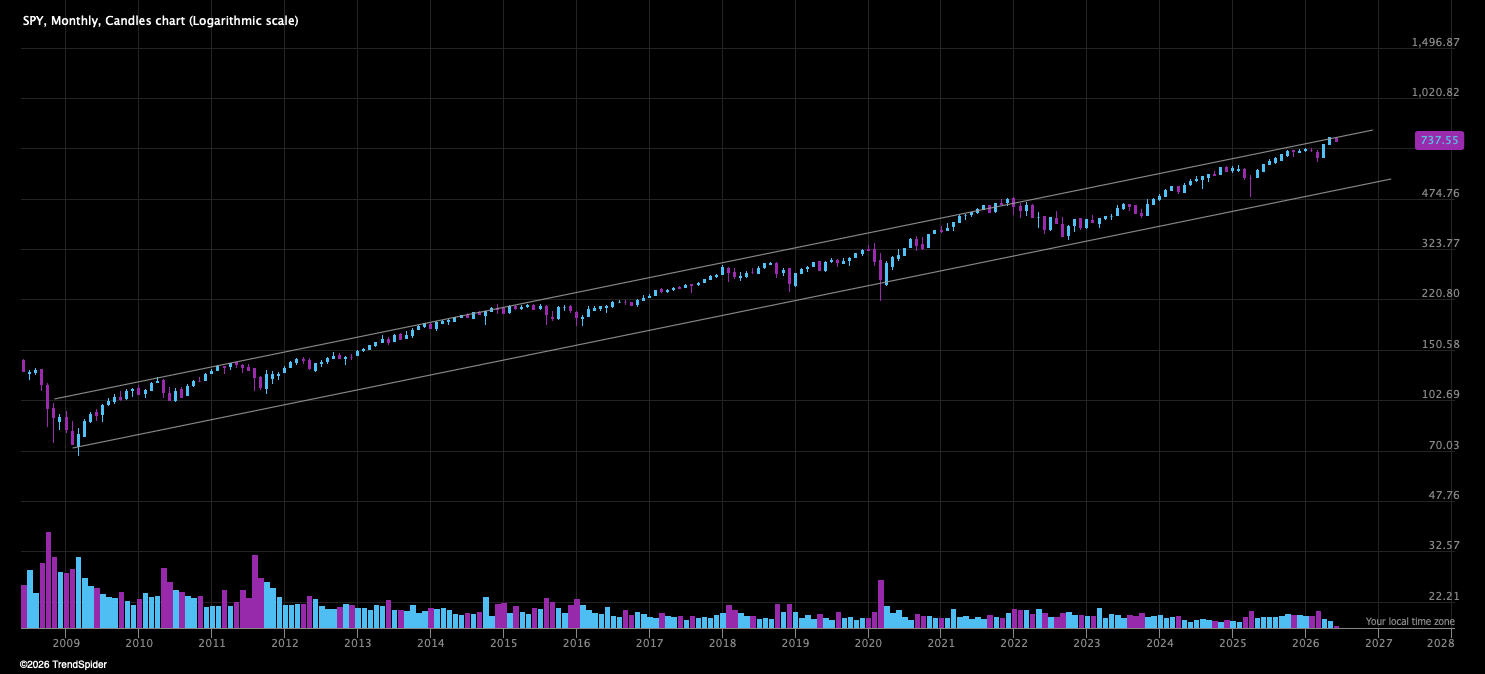
I showed you this chart two weeks ago and told you that this historic two decade channel matters — and that we should at least be a bit cautious at historic resistance.
Not really surprised we are stalling here.
S&P 500 — Levels That Matter
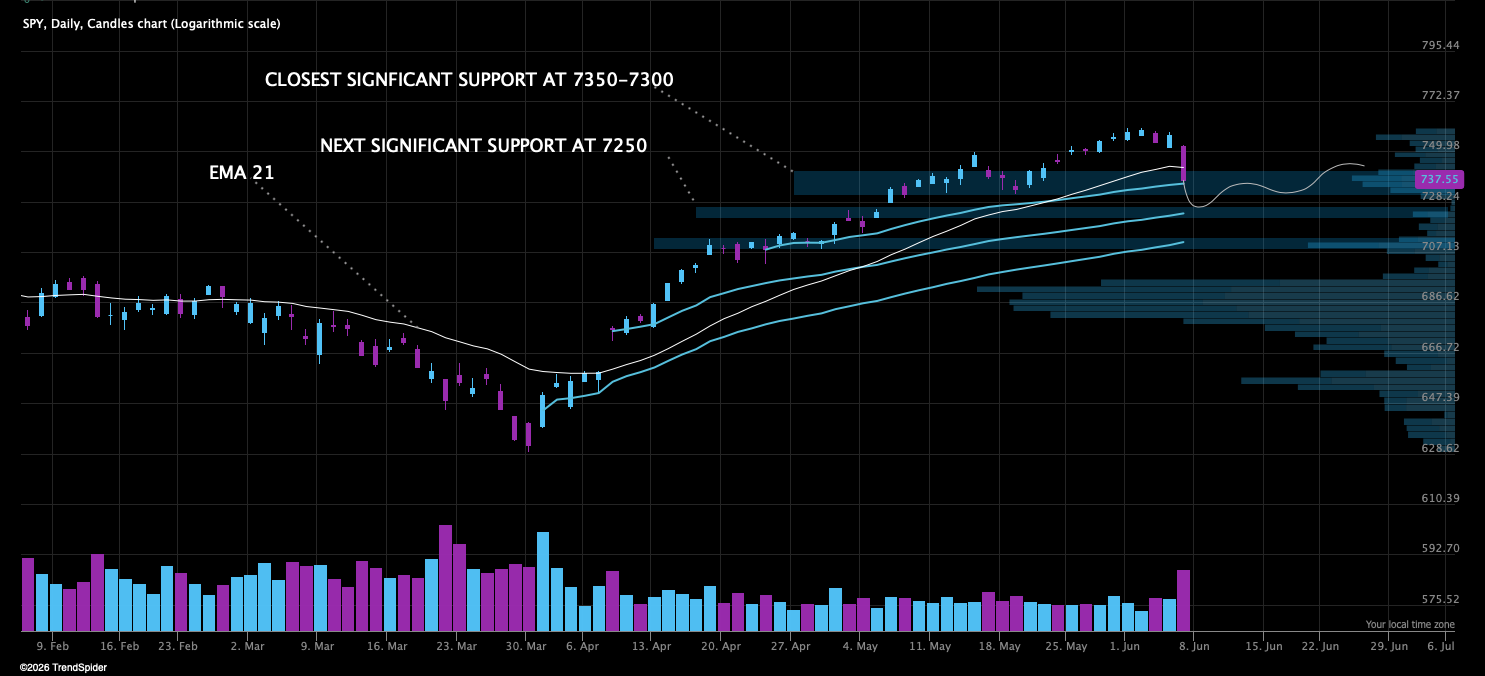
Some core principles in price action of indices to understand:
After an outsized move down like this, the edge for going short is usually incredibly unfavorable. There are always outlier black swan crashes, but outside of that — don’t short in the hole
After we close a Friday day low on a big move like this, historical data tells us that low is almost always undercut — and the natural level for an undercut is the prior higher low
Undercutting a prior low and tagging 7250 will cause a strong liquidity release, which is what turns the market. As long as we don’t get any weekend pump my base case is early week weakness with a painful shakeout down into the followthrough day AVWAP and 7250 where a low can start building short term
Nobody knows what will happen, but as long as we live under EMA 21, be very careful under EMA 21 things can escalate to the downside — weakness like this should be respected
A bounce tells us nothing at this point, a bounce is expected the indices are severely oversold, it’s mechanical not demand driven.
What happens on the next test supply down after the bounce is what matters — that will tell us if bid is there or not
But looking back, whenever we get a real high volume dump WHILE in an uptrend, the market often recovers soon. History doesn’t have to repeat, but that’s still there.
There is always a risk of an immediate flash sale and a real dump with equal force like Friday, that would likely take us to 7000 which is strong support and where the 50 SMA and the April lows AVWAP is. That can become a quality low, if the market want to really shake us out it will take us there and likely turn short term. The ugliest and most frustrating scenario, but doesnt seem very likely.
Friday’s move was mechanical caused by the VIX setup, the compressed realized vol, low correlation and elevated call skew unwinding, that is what will cause a cascade of selling like this that never stops.
But don’t forget that rotation into defensives started before that move, the cascade down was amplified expression of the underlying regime shift that preceded it.
Avoid being overly bullish or overly bearish — remain objective until we have more information.
We Are In A Negative Gamma Environment
Simply put, in a negative gamma environment, market makers sell into selling and buy into buying — amplifying the moves both ways.
In positive gamma environments, what we experience as the easy grind up, market makers buy dips and sell rips which makes the market more stable — which is what a favorable environment for swingtrading looks like.
(Source: www.menthorq.com)
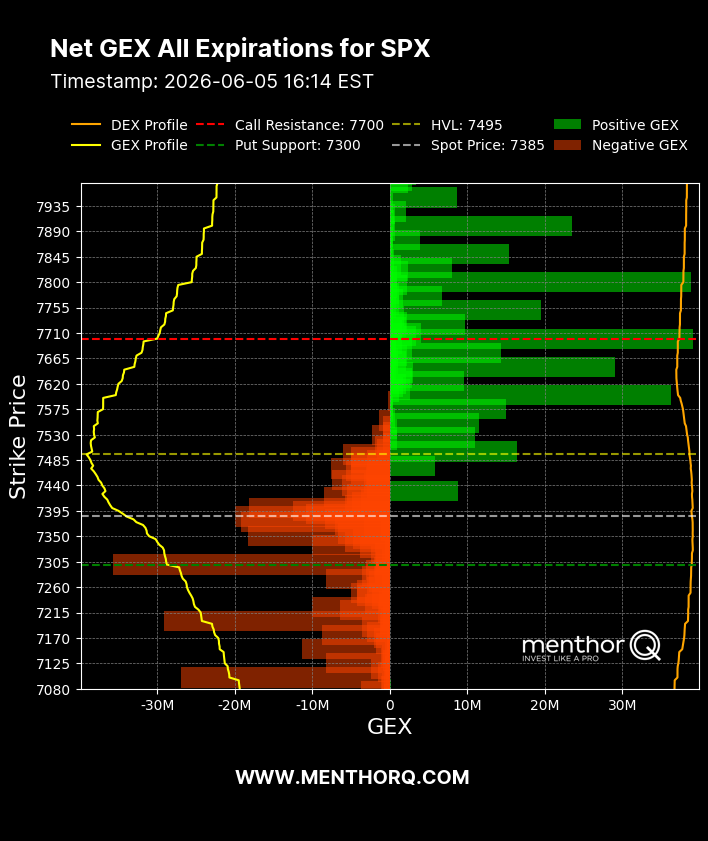
Back in negative gamma, which means moves are amplified both ways. Shakeouts and double shakeouts are more likely. Much tougher trading environment.
Put support in SPX at 7300 is key and the closest support.
Sudden Re-pricing Of Risk
And here is where we need to try to understand, if this is a short term re-pricing of risk due to an overcrowded call positioning in a compressed volatility regime.
Or a real structural macro bear. And the answer is, it’s likely too soon to say.
But we saw puts becoming expensive quick on Friday, people payed up for puts across all expirations — real hedging, real re-pricing of potential fear and weakness.
(Source: www.menthorq.com)
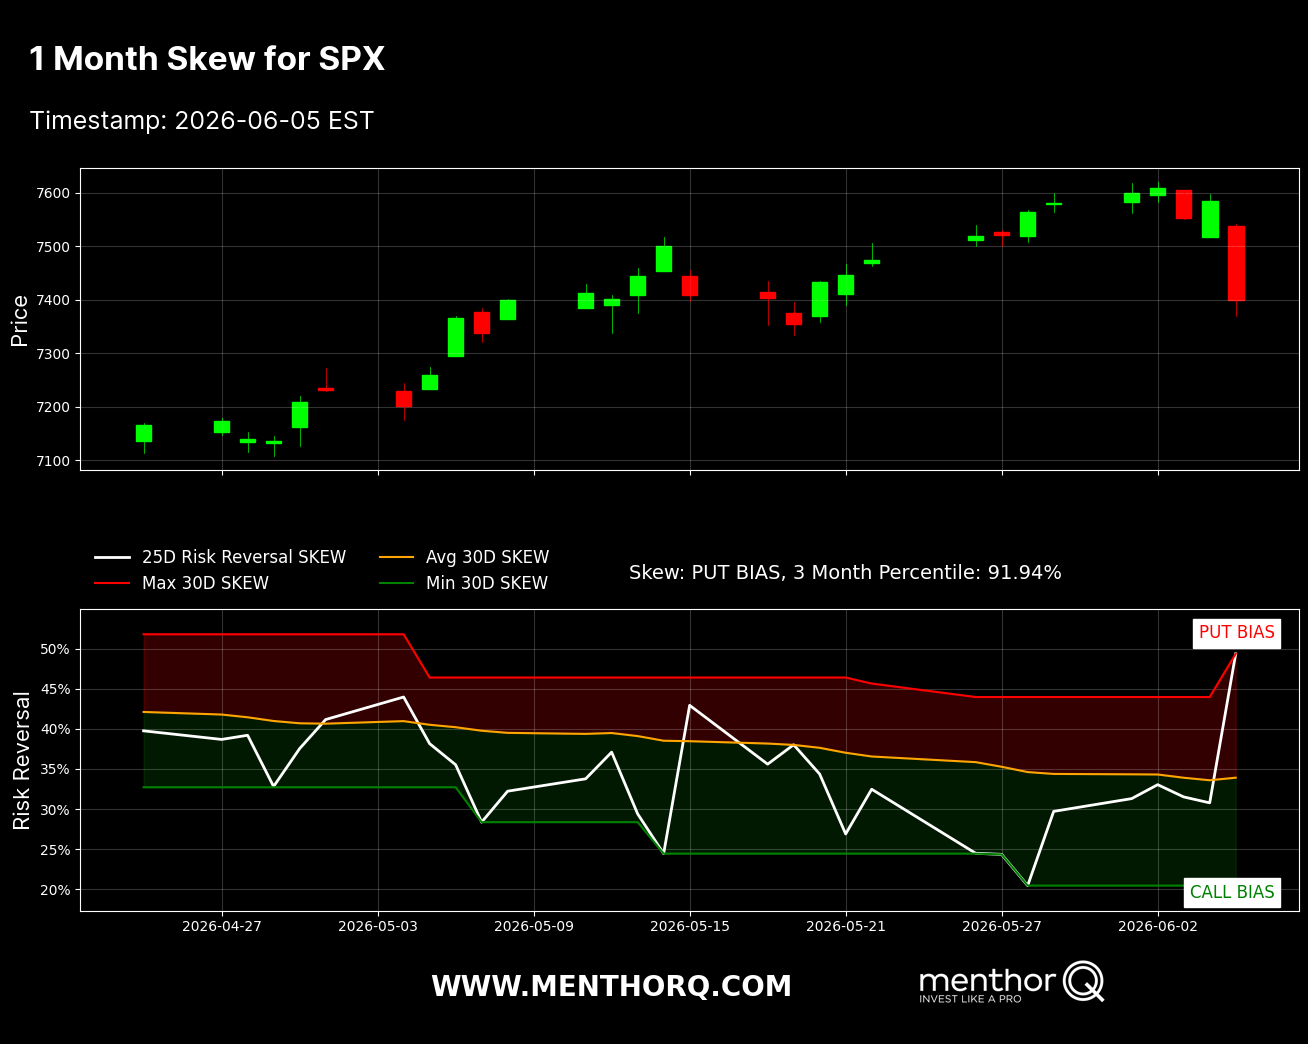
.Will it last, that’s a whole other thing, but the tree was shook.
CTAs De-leveraging
CTAs follow trend, and they flipped to sellers, but have not sold much yet.
(Source: www.menthorq.com)
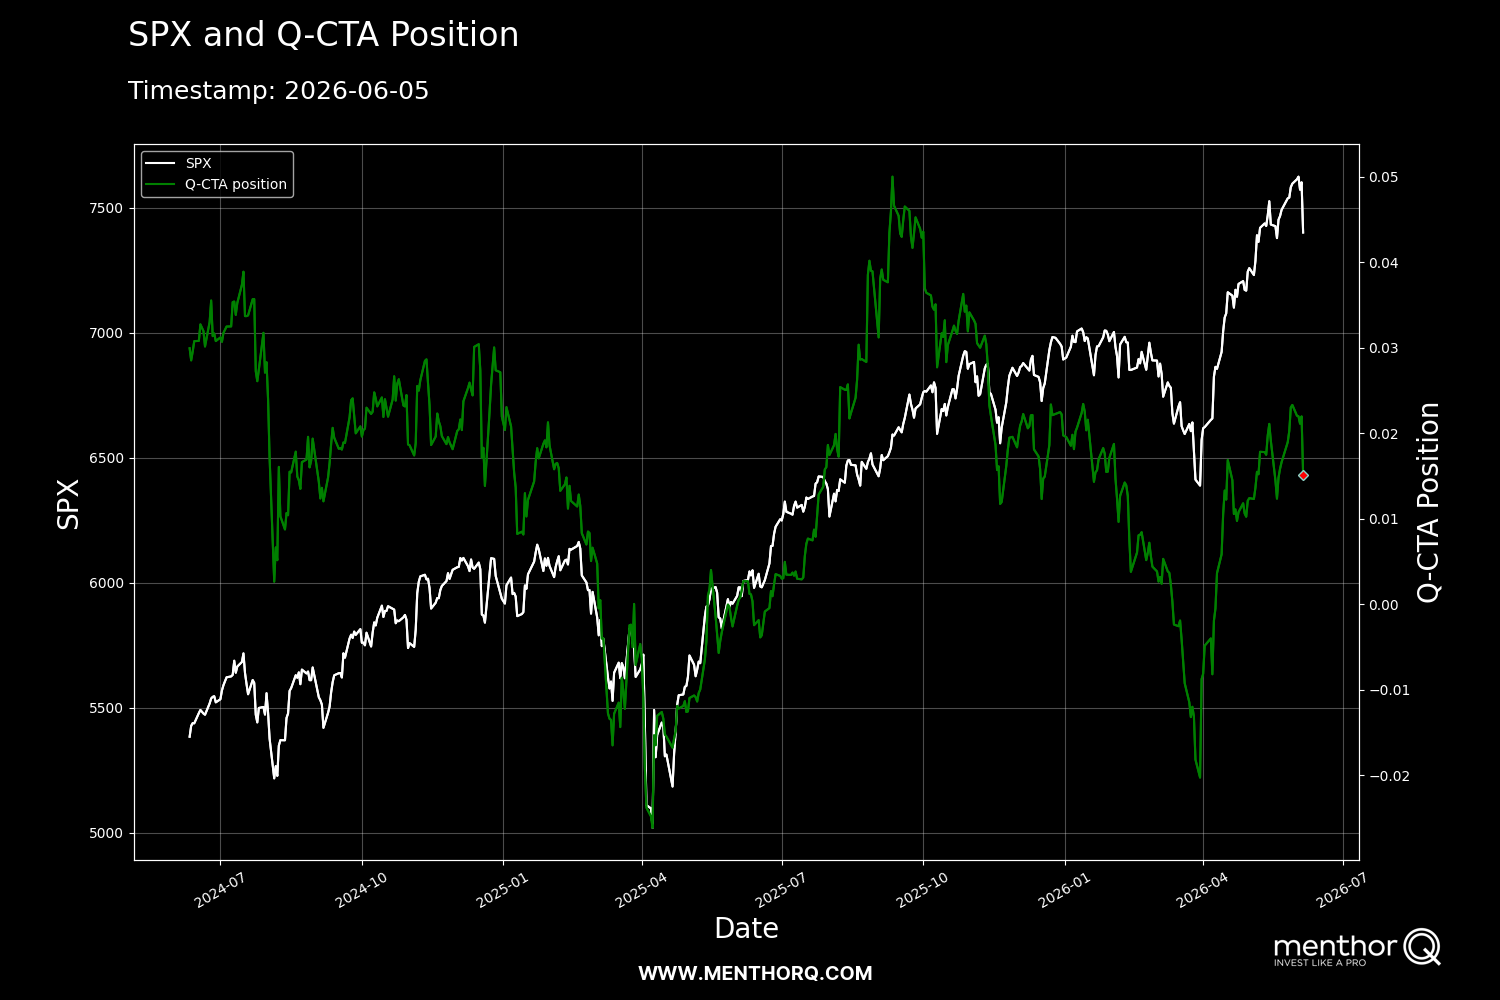
And Goldman Sachs latest projections are interesting. Next week, they have limited activity regardless of market direction, selling will likely be contained and limited.
But if weakness is sustained they will become heavy heavy sellers over the next month. They will become a significant down force in the market if the market can’t hold up in a longer timeframe from here.
Calm for now, potential pain later depending on what we do from here, we will see.
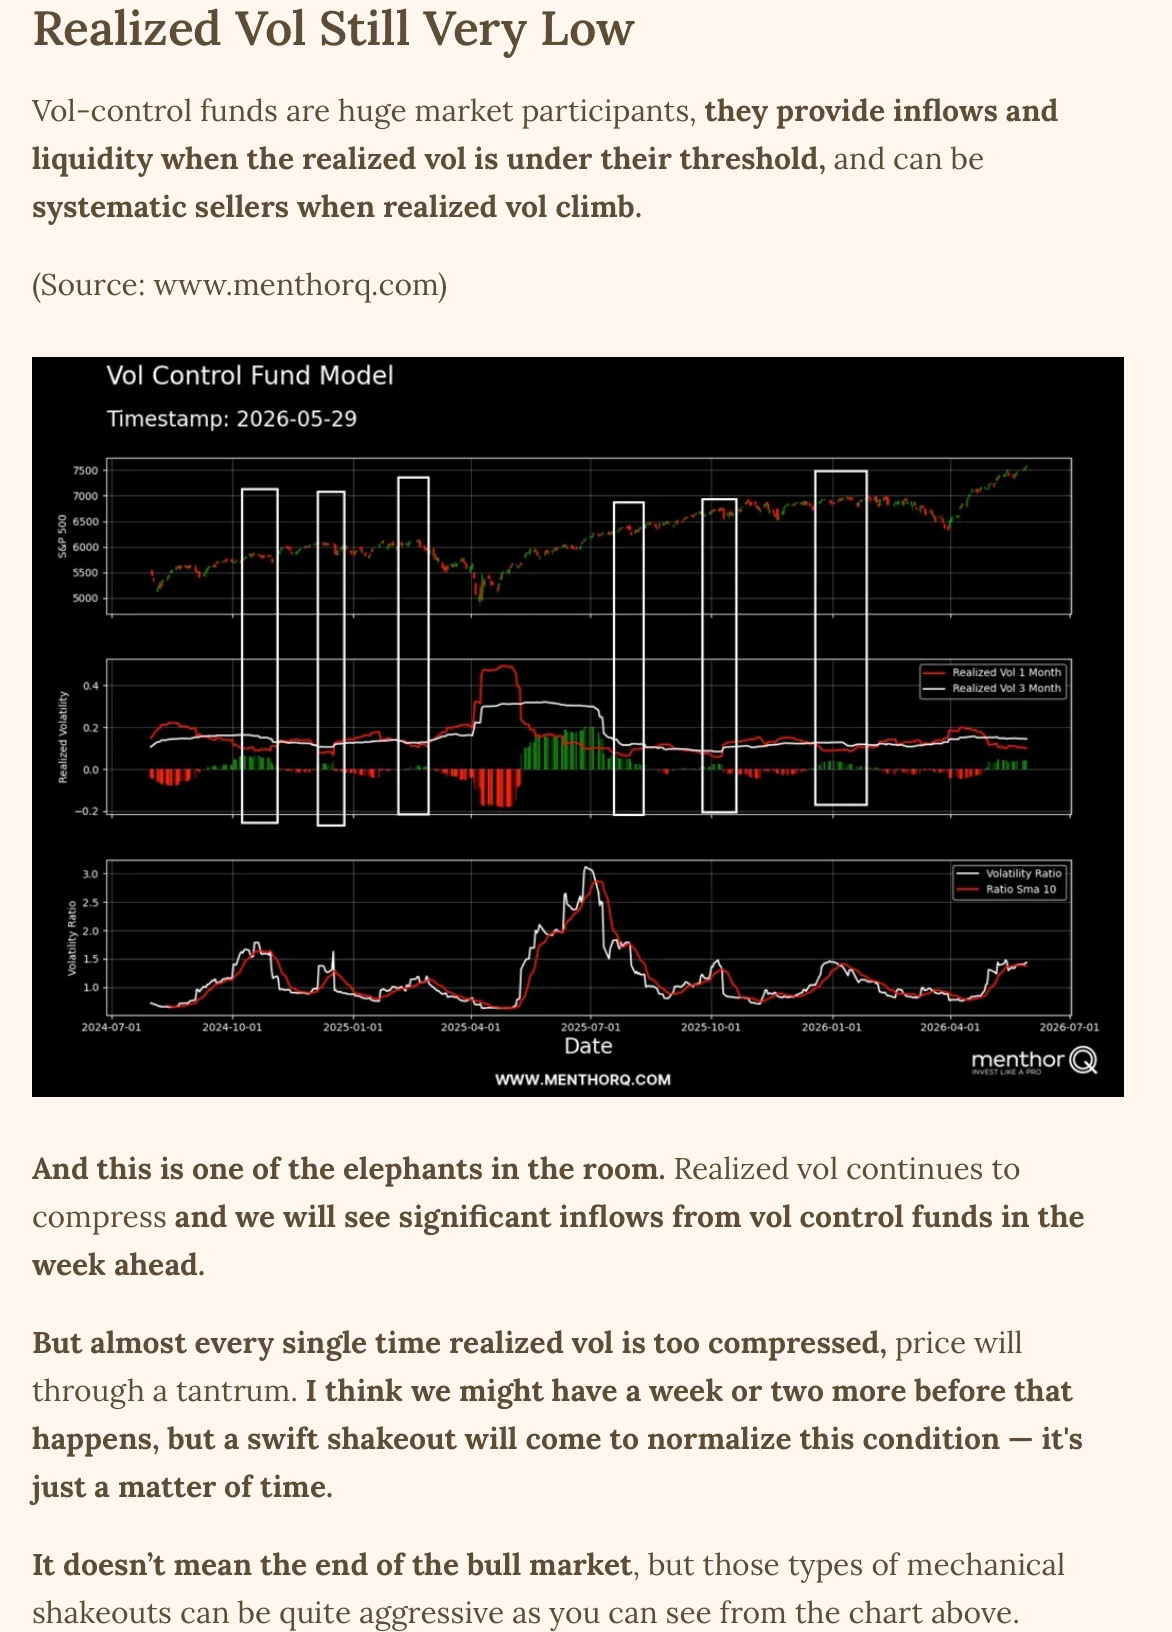
Vol-Control Funds Will Sell
Vol-control funds are huge market participants, they provide inflows and liquidity when the realized vol is under their threshold, and can be systematic sellers when realized vol climb.
(Source: www.menthorq.com)
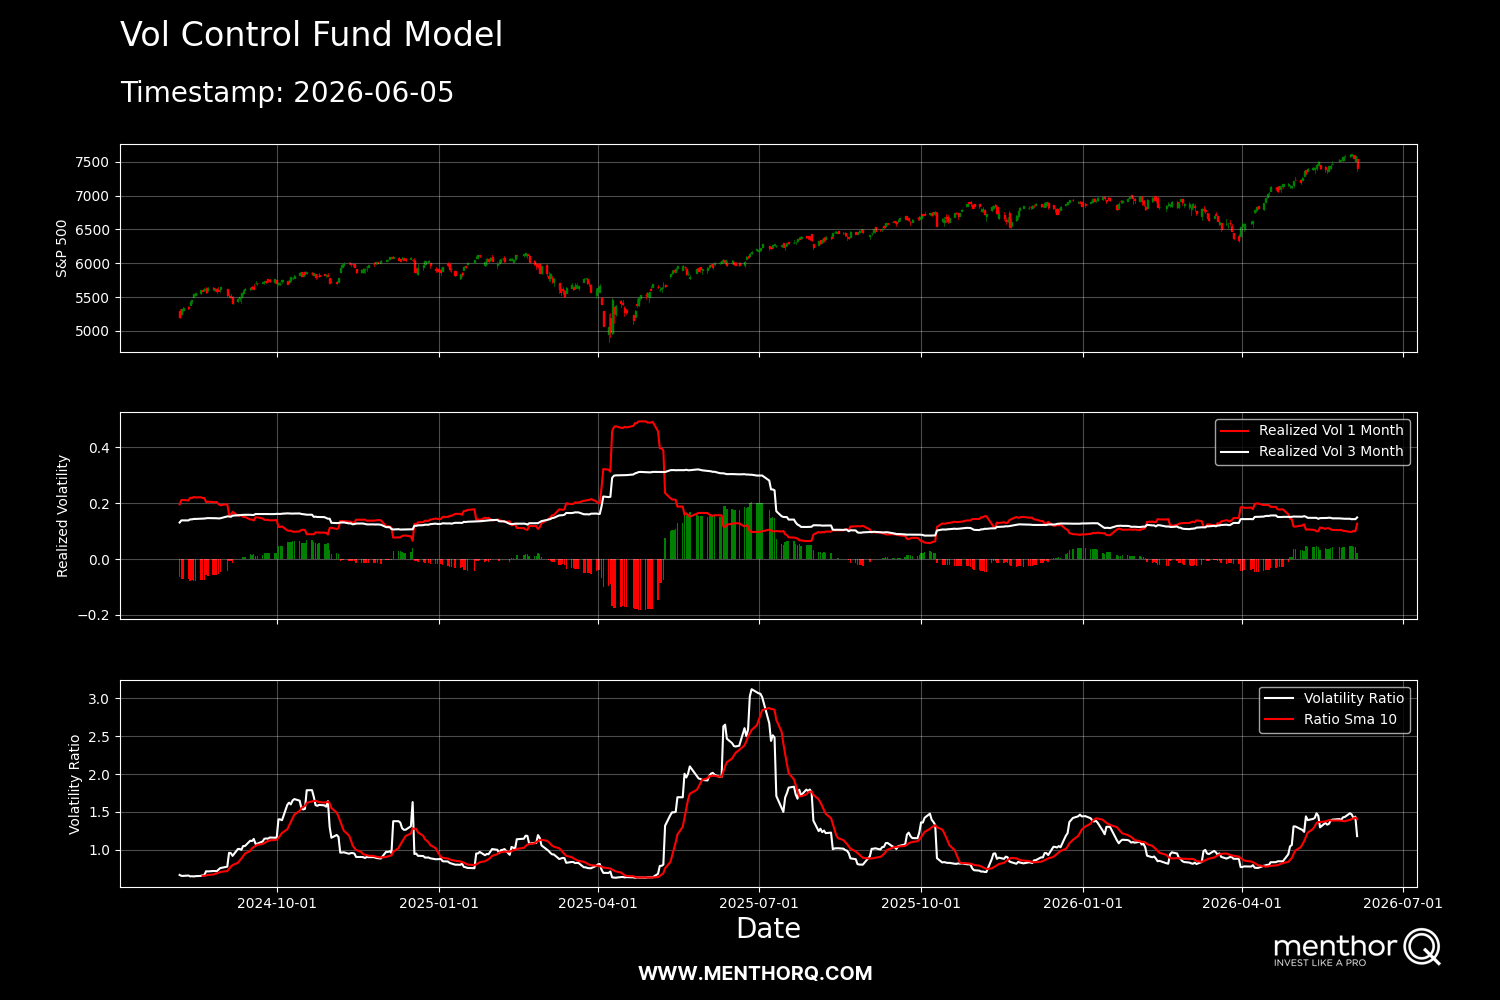
Realized vol is in climbing mode, and if we get some more volatility next week, up or down — they will start being systematic sellers into that volatility.
They don’t care where the market is heading, they sell when volatility increase.
Vol-control funds will likely be a headwind for stocks short term. That doesn’t mean the market must tank, it’s simply means it’s added selling pressure.
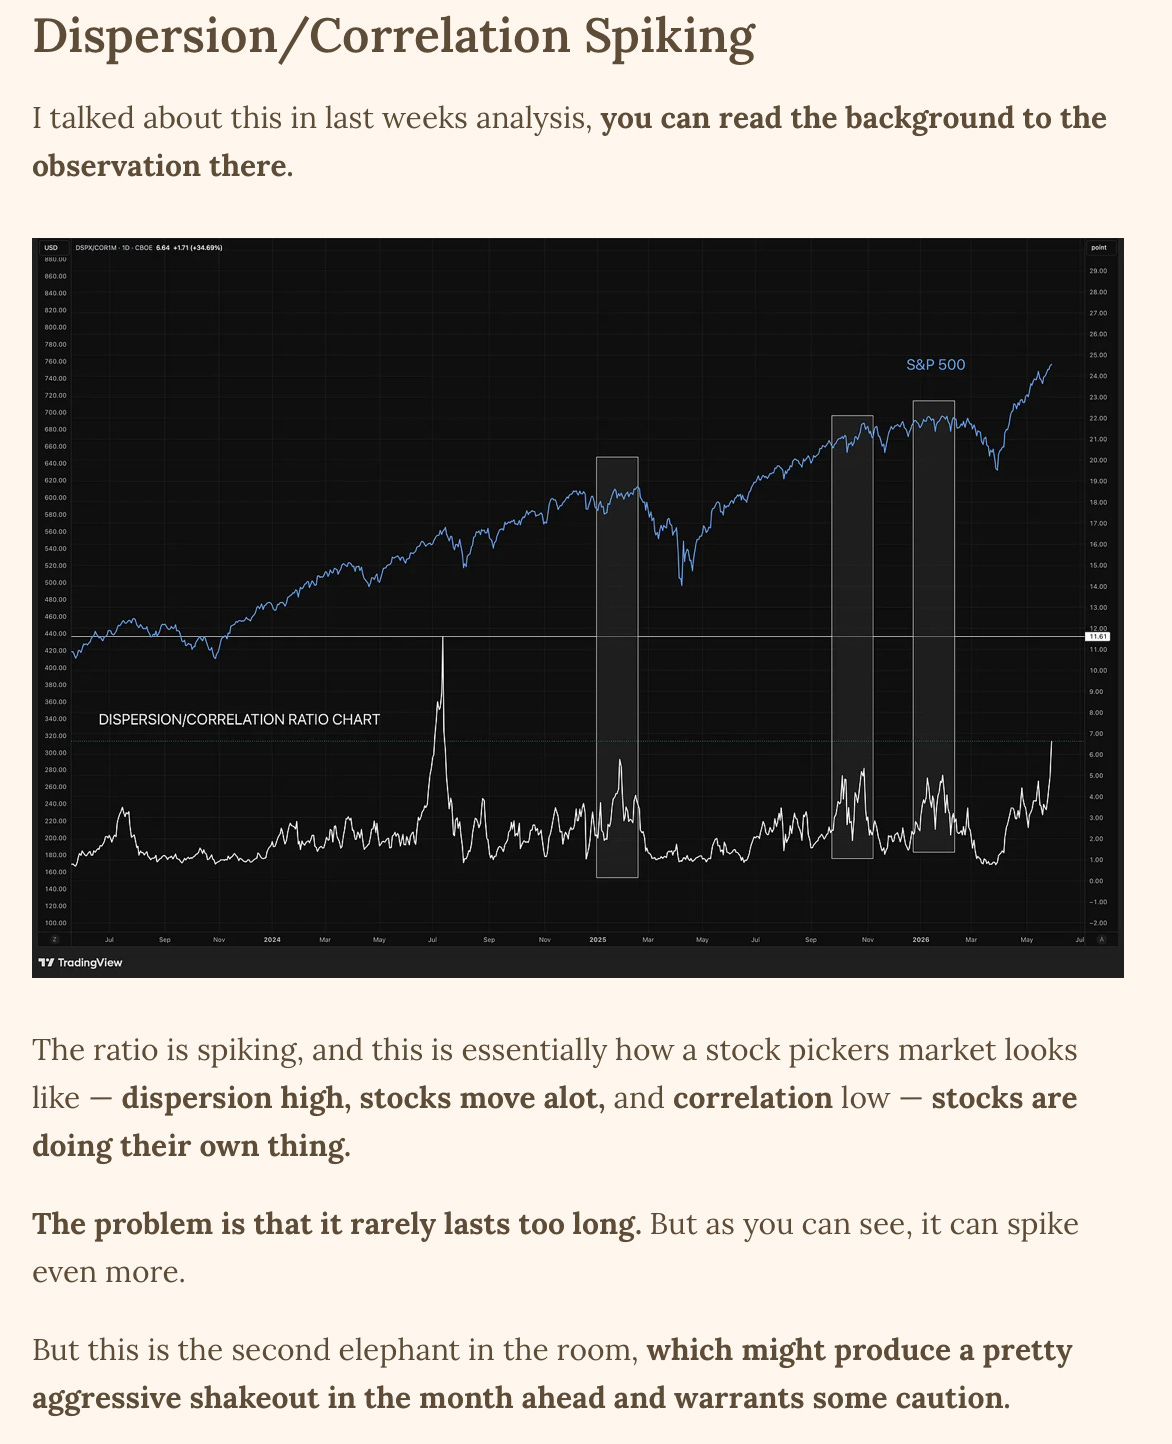
Dispersion Falling And Correlation Rising
We went through how to interpret dispersion and correlation as well as the ratio between them in this post, if you want some background you can look there.

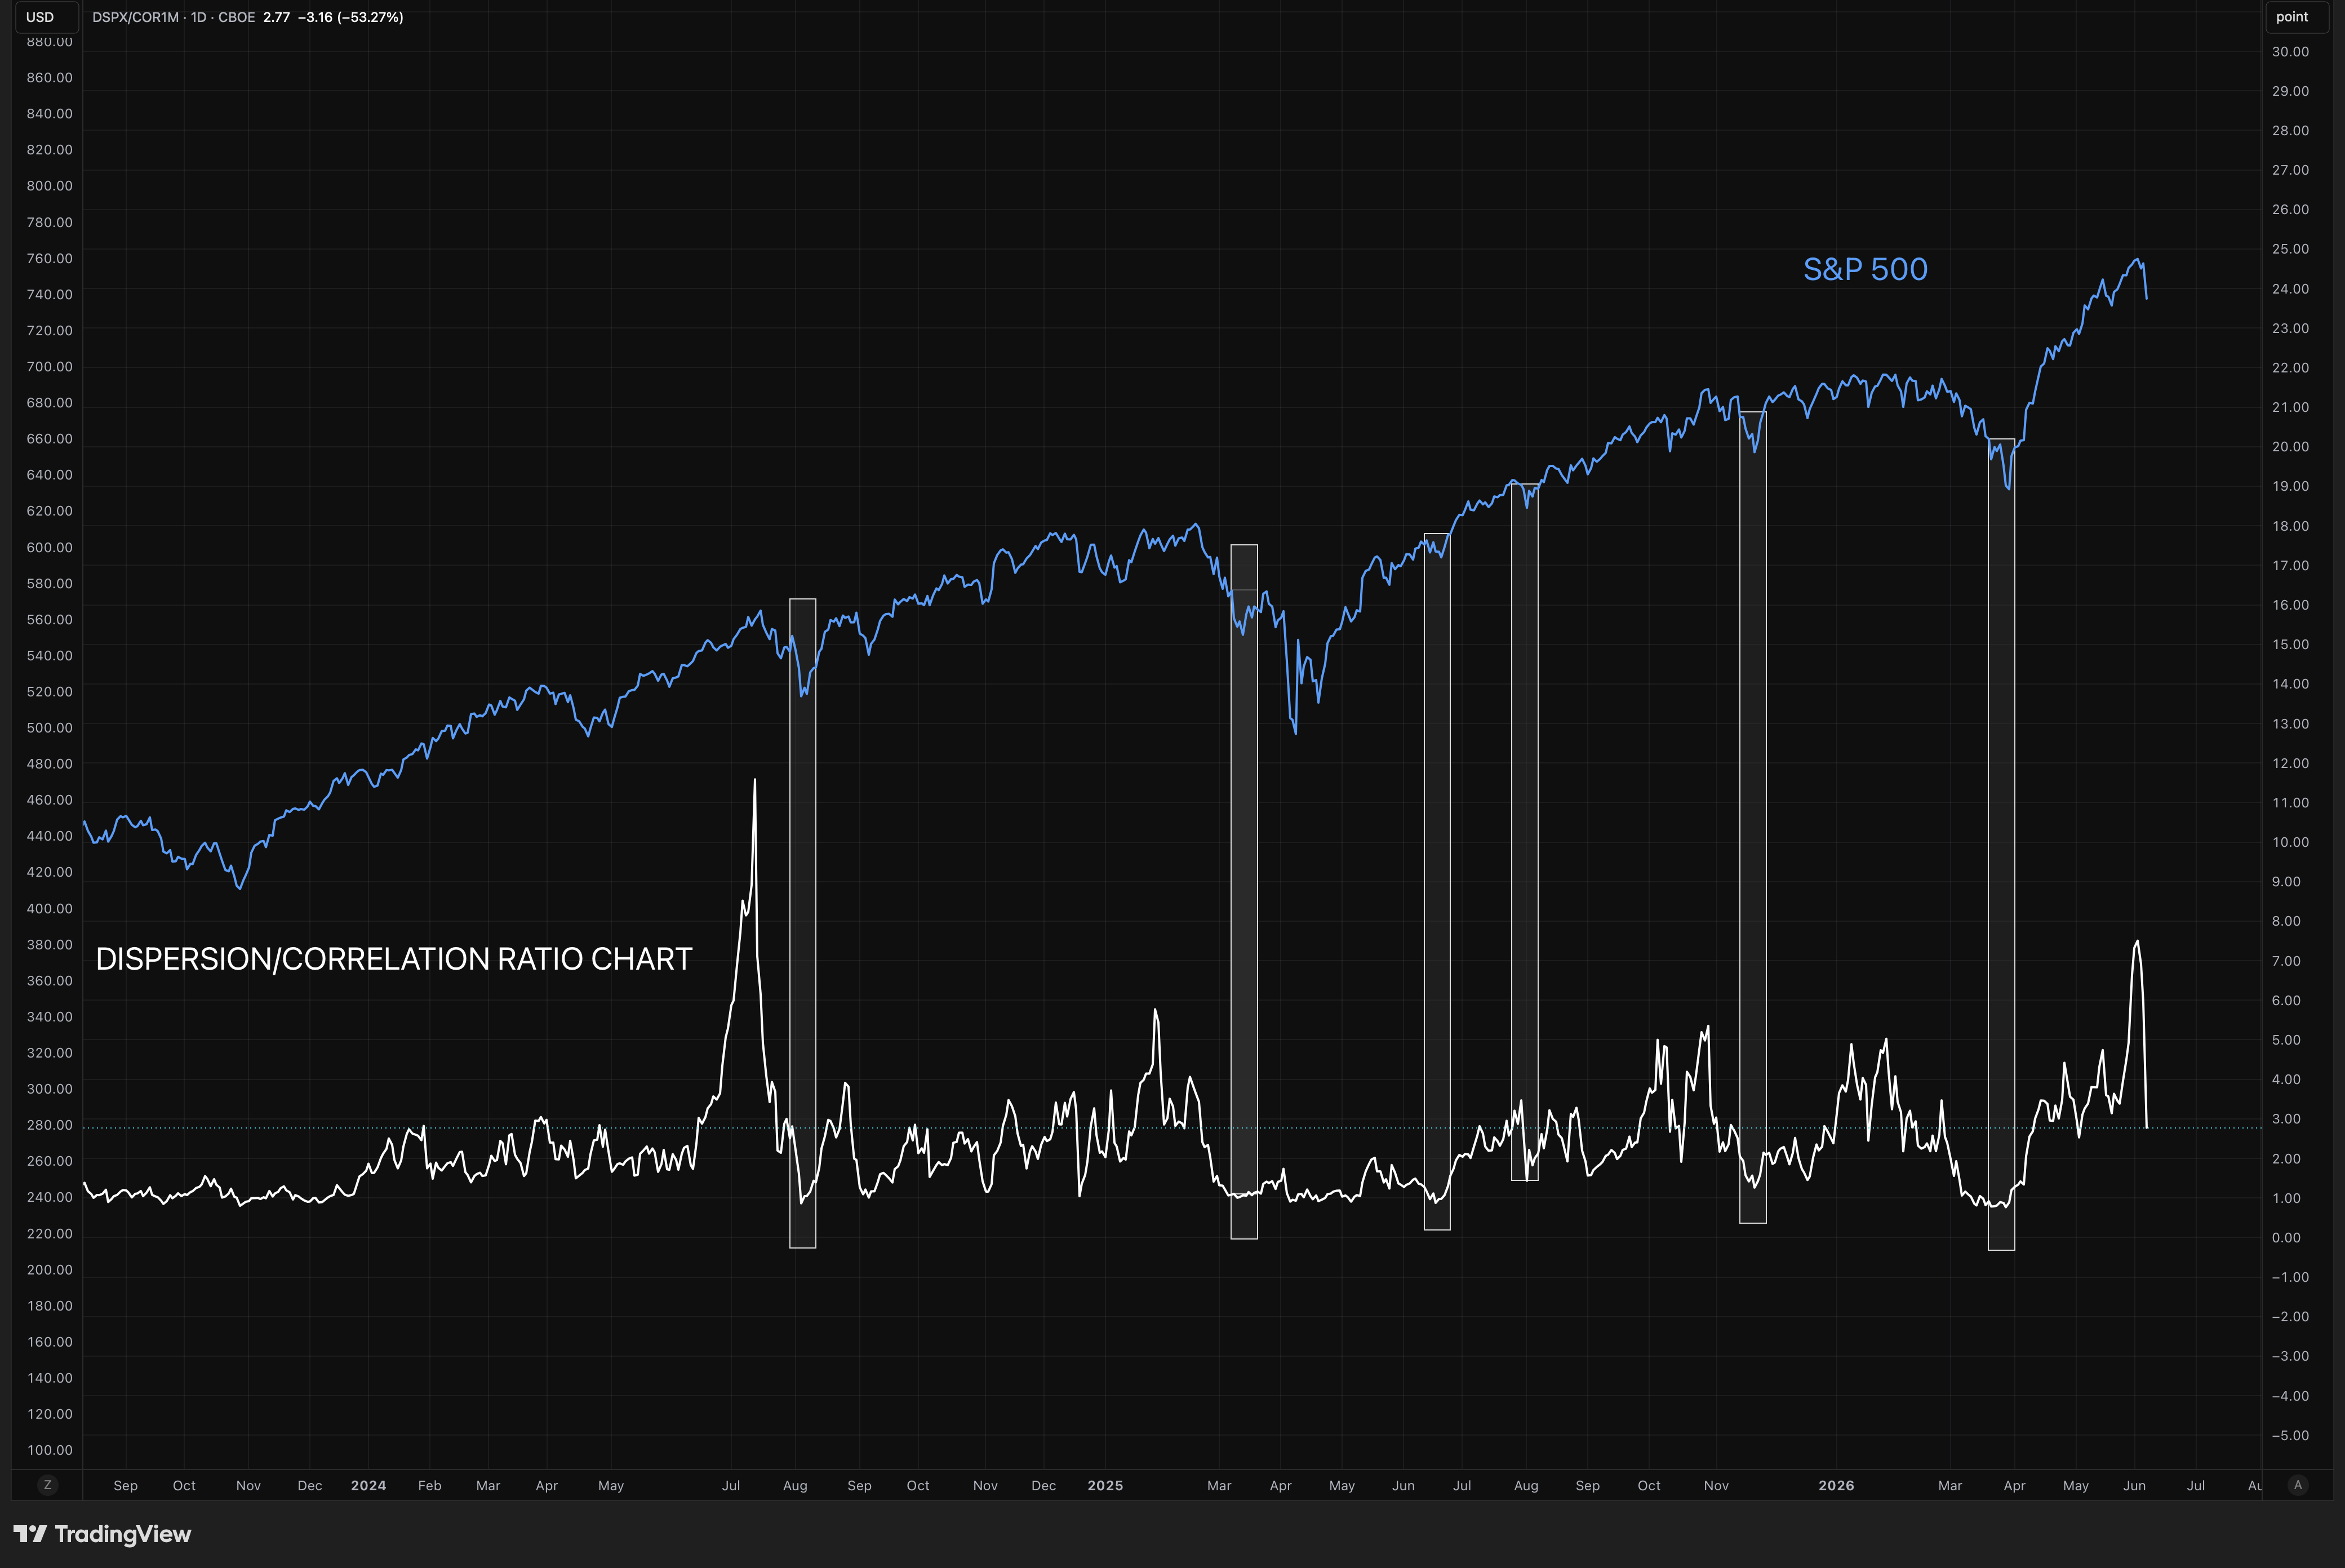
This was a great signal, when the ratio spiked, that marked the top. Because that’s the ideal swing traders environment — and that never lasts long.
The ratio is falling heavily as dispersion is falling and correlation is rising. Correlation rising means stocks are expected to move together, like they do when weakness starts.
And just like we used it as a signal to find a top, we can use it to find a bottom.
Watching.
QQQ Weakest Of The Bunch
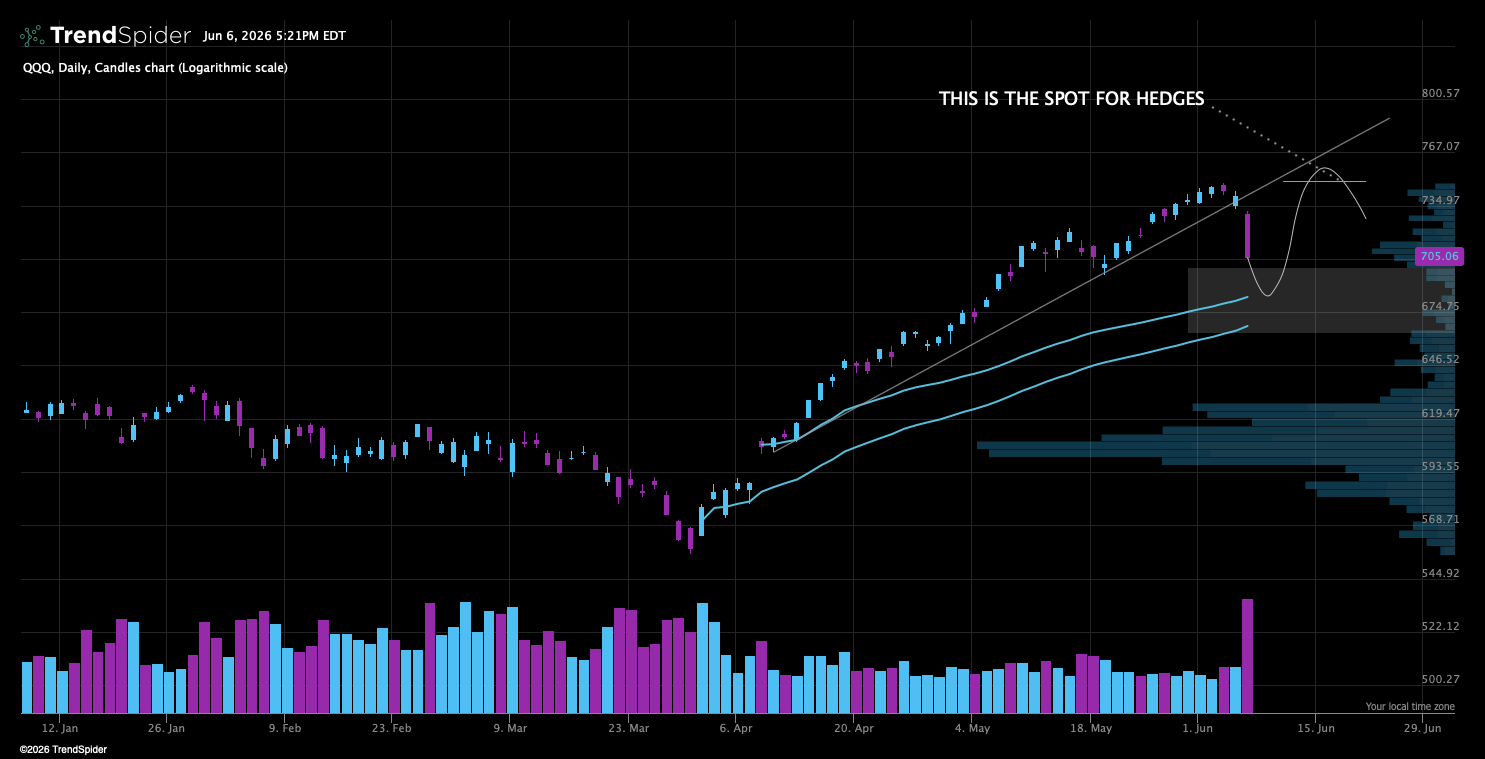
And if Trump’s weekend AI pump doesnt work, I can see some downside for the Qs. If we lose this spot we are in a volume pocket, and will need to fill it. 5% more down to the April lows AVWAP is a logical spot to turn if we get more real weakness.
And don’t forget, this is not the place to short, you short on a failed bounce up rejecting the prior support trend line.
Small Caps Are Still Fine Bigger Picture
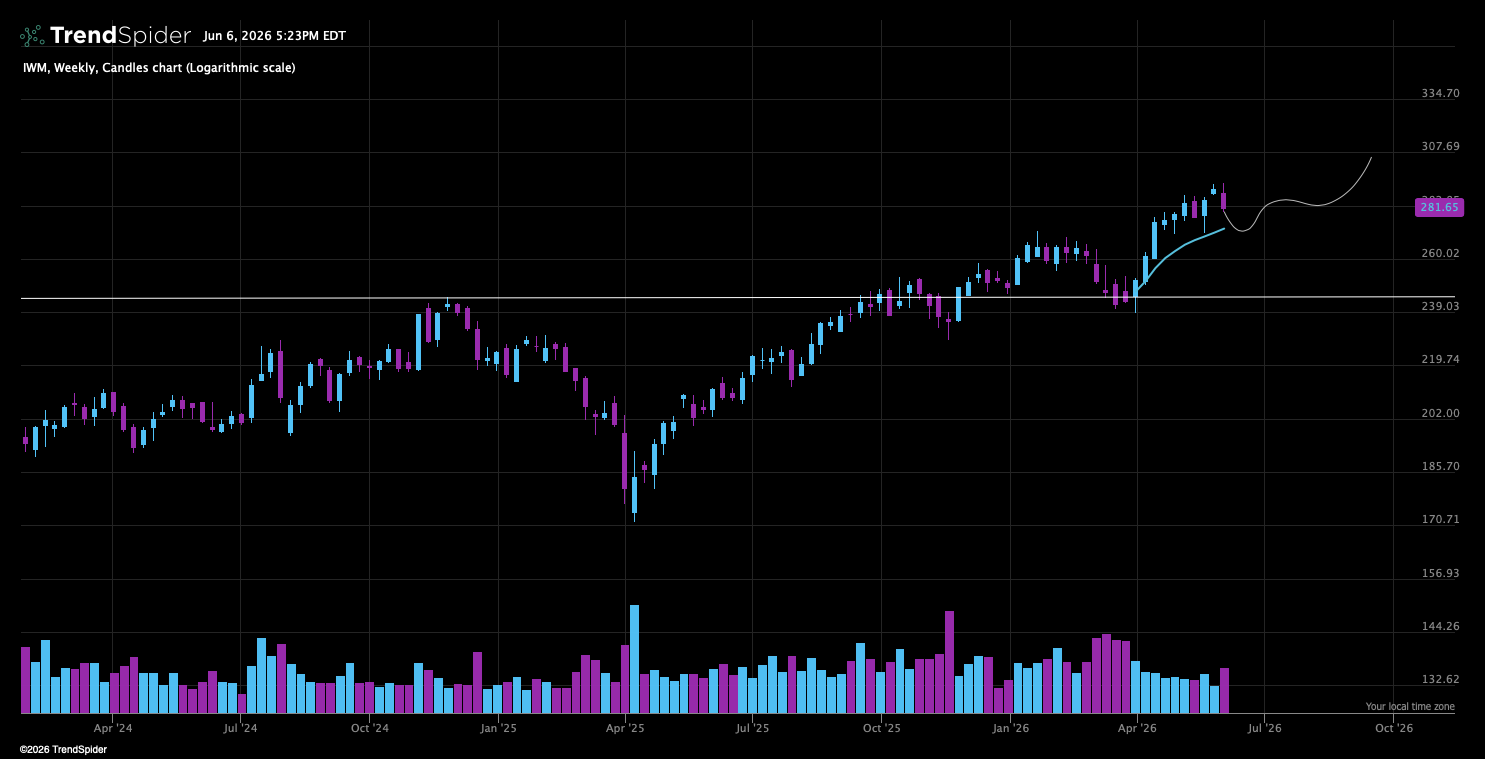
Even some more downside here would be natural, they remain in an uptrend.
And interestingly small caps are improving under the hood in Analytics.
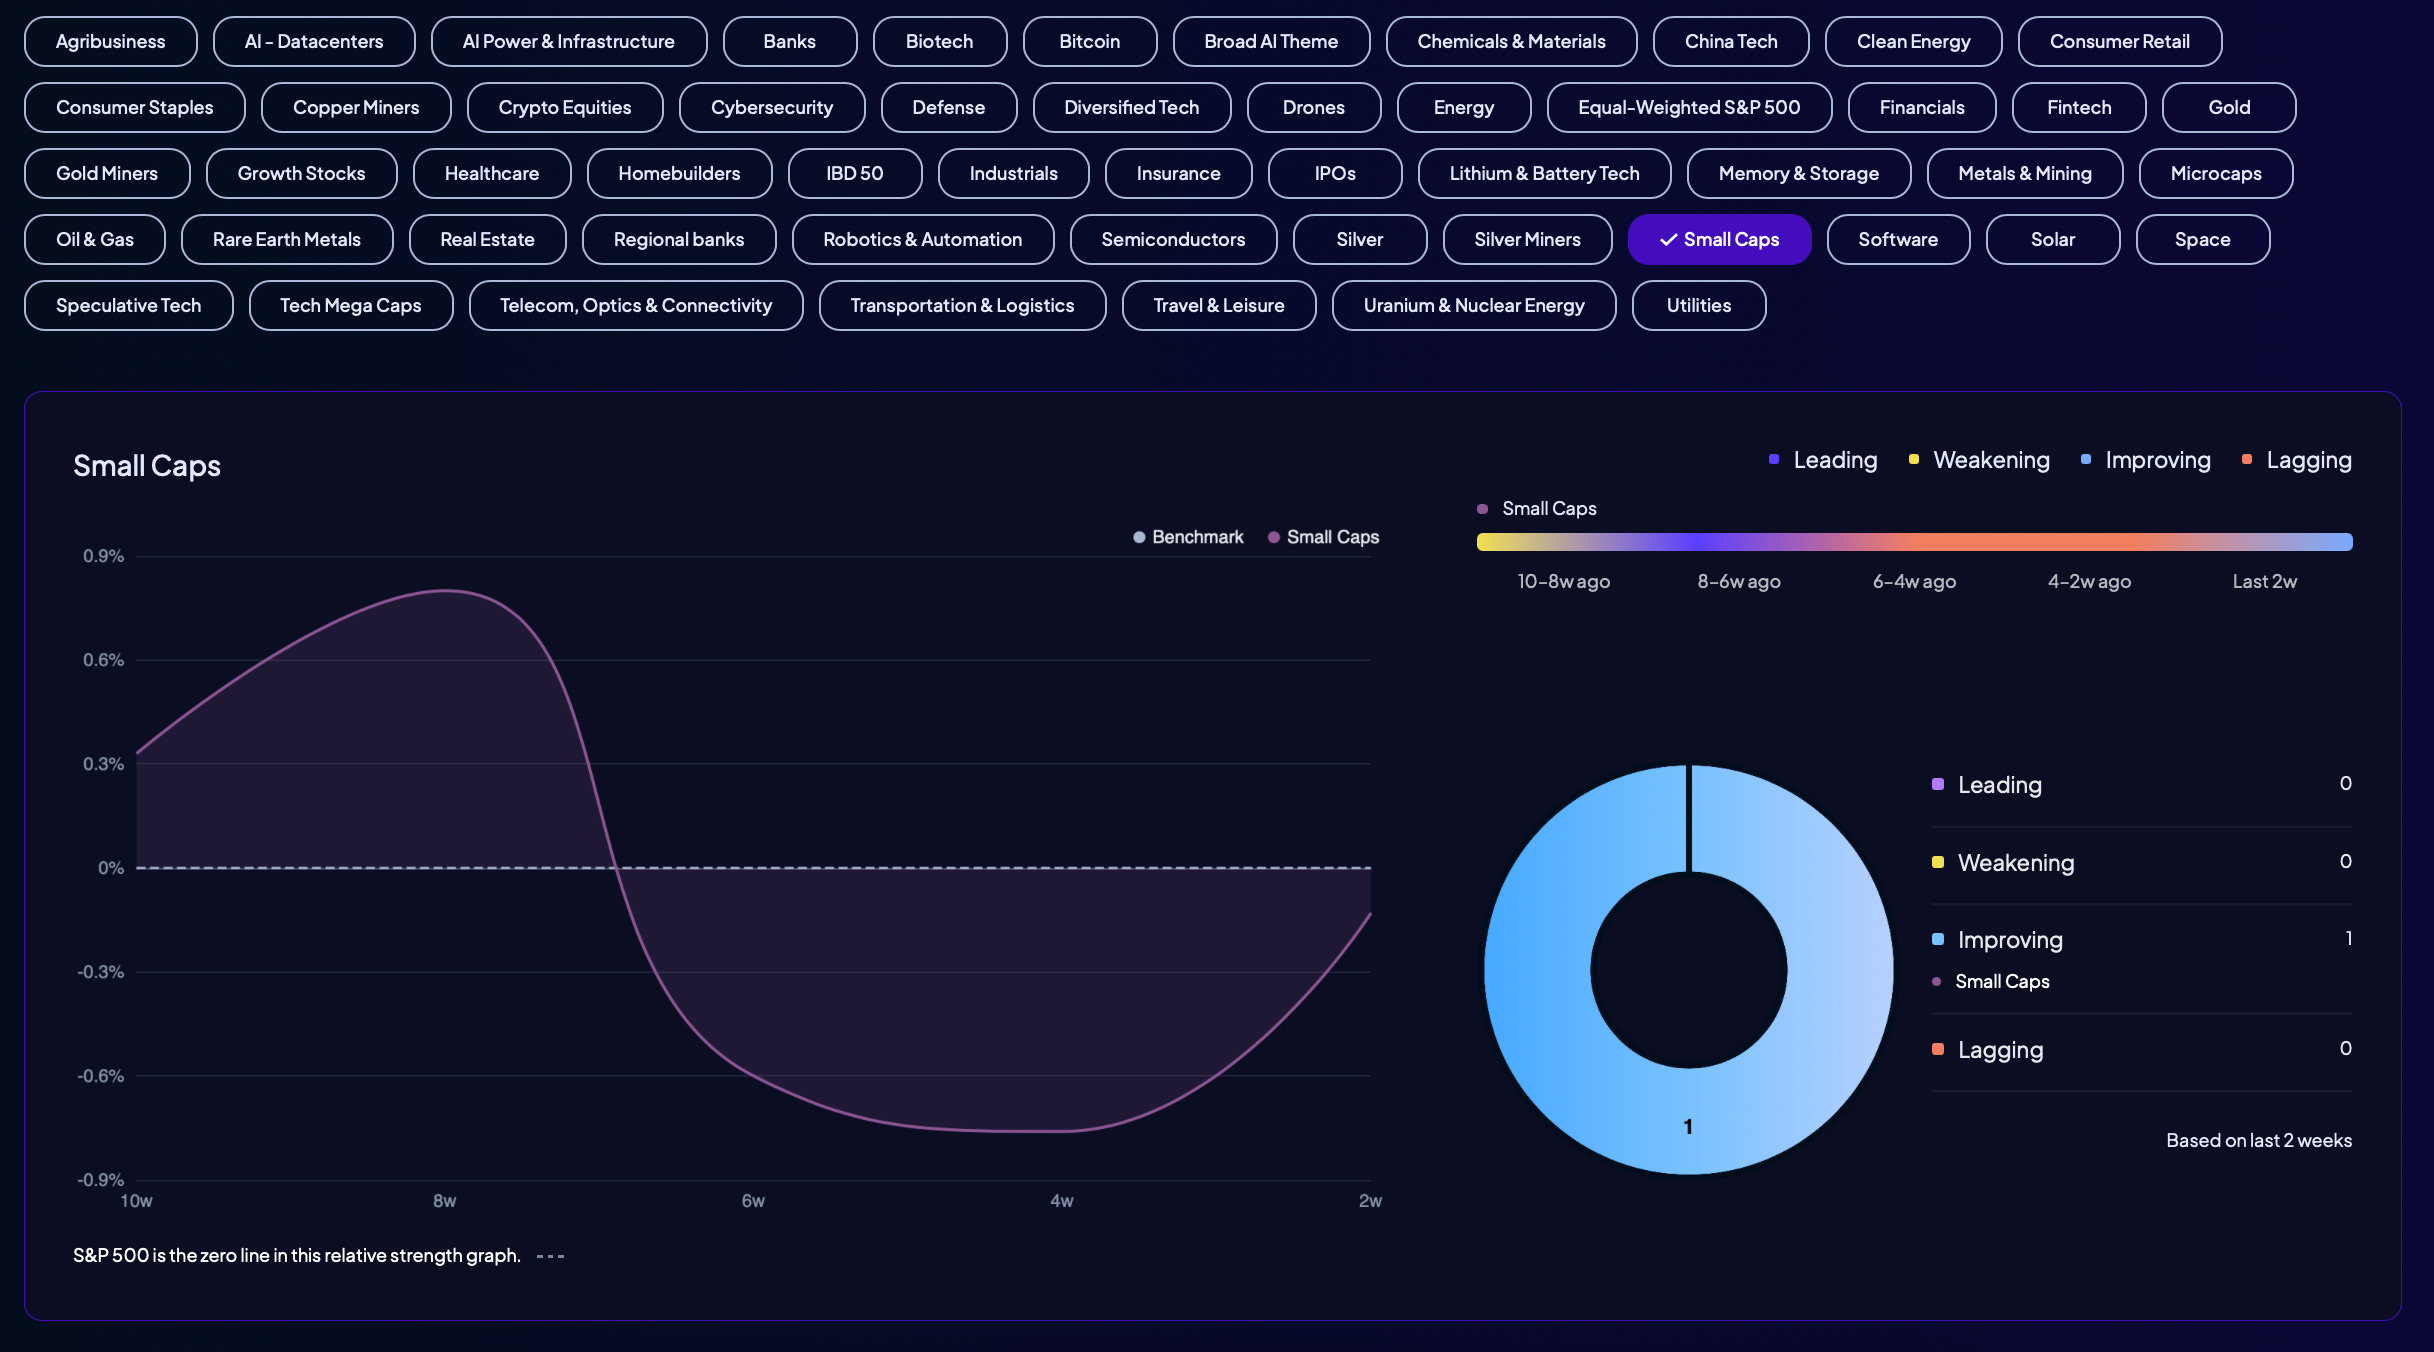
RS acceleration is improving over the last two weeks, I would have expected the inverse. Small bullish clue from analytics?
Lets see if it will be sustained.
Value Bidding
And this was really an awesome signal, I have showed this chart to you during the last couple of weeks. And told you that whenever growth excessively outperforms, we are close to a top and weakness.
Well it worked this time as well.
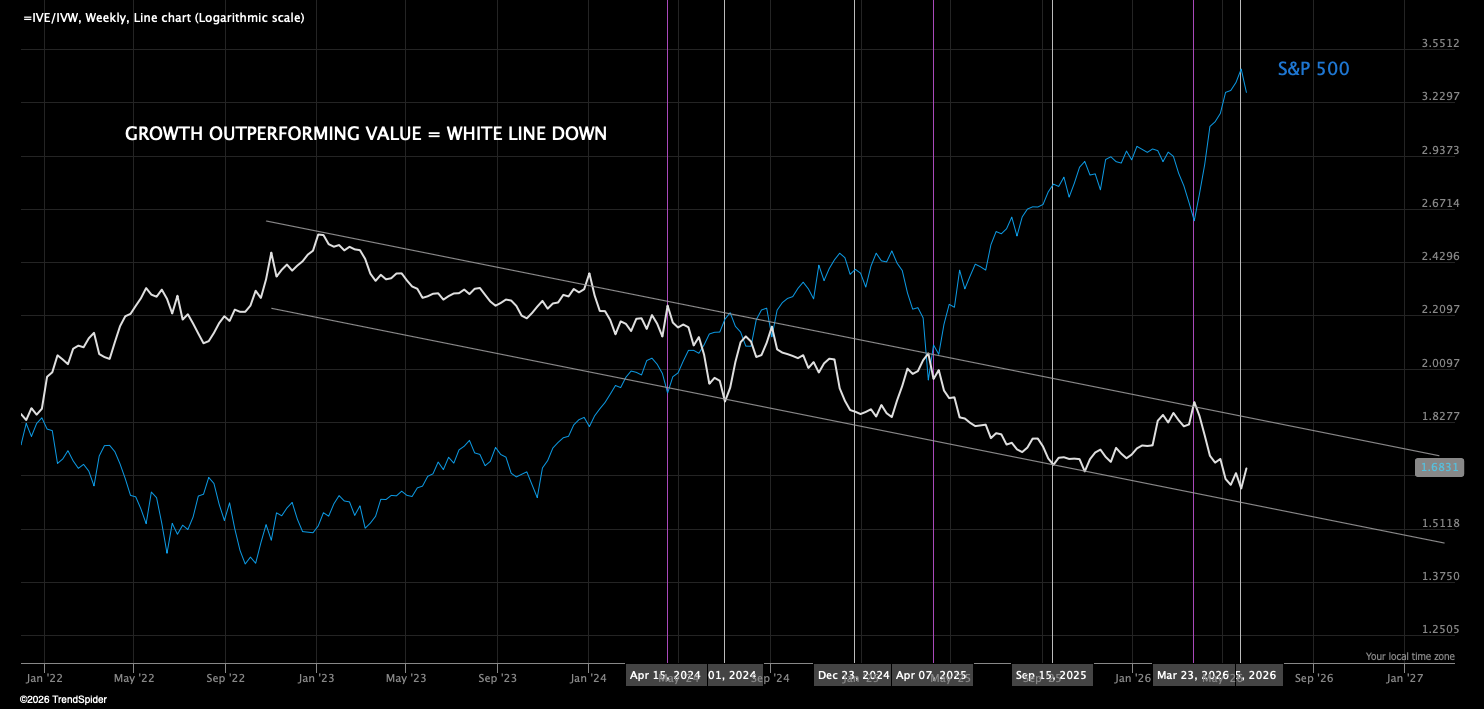
And I like simple signals, they are often the best. We can use the inverse now, when value excessively outperforms growth — we bottom (purple lines).
Not close and lets see how long this rotation lasts.
Can Someone Tell Me Why Homebuilders Aren’t Tanking?
If this decline was due to rate hike expectations picking up, why are homebuilders not being obliterated here? The most rate sensitive sector on the market.
Clear RS on Friday outperforming the market.

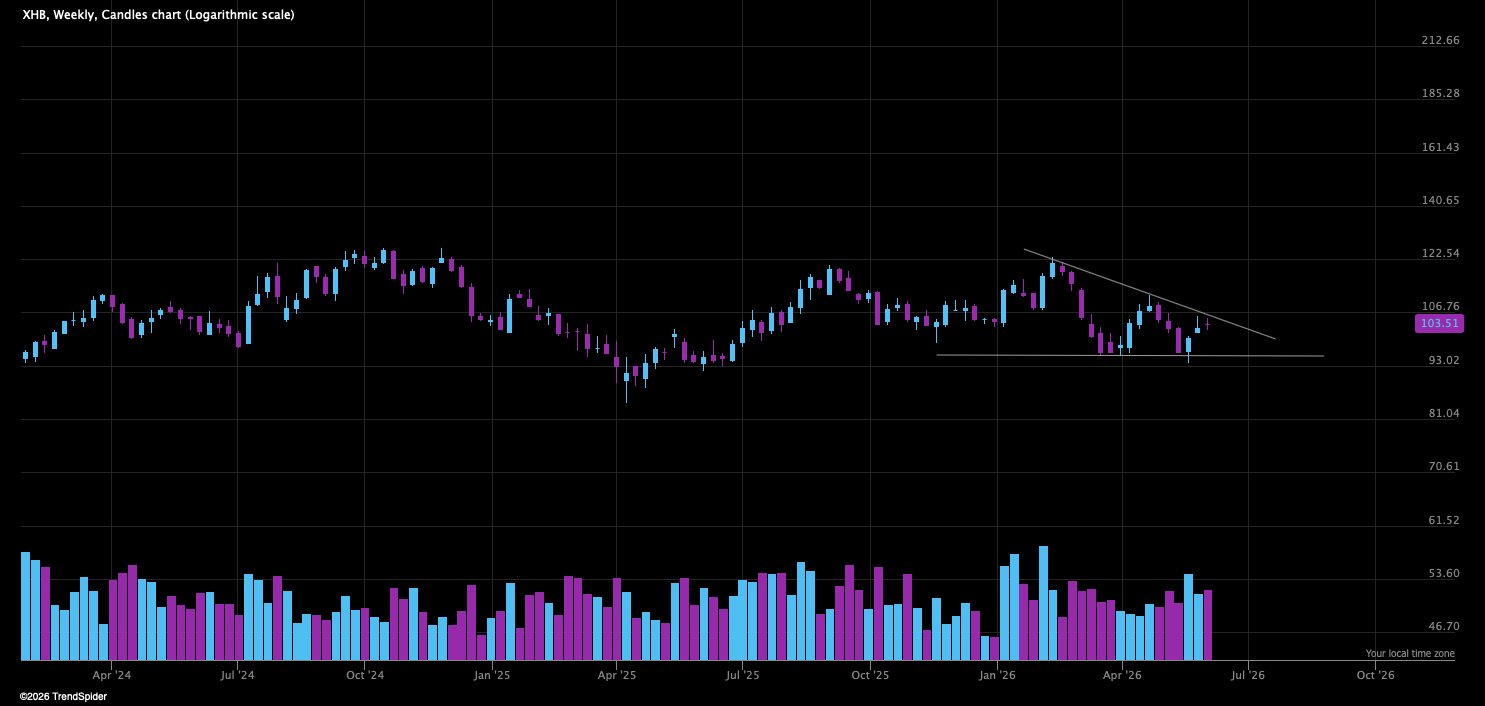
Maybe they will tank, or they are bottoming. But it is suspicious, I highly doubt this decline was a about the rate policy.
Current high yields is a yellow warning sign, and rising yields and rate hike expectations might pressure the market going forward, but this wasn’t the cause of Friday, maybe the culprit but not the cause of the result.
And looking at the VIX of bonds — the MOVE index confirms this. Slight tick up, but zero panic here.
And when we get panic in the MOVE, that usually marks the low.
It is important to understand that when the market is vulnerable, with VIX compressed, elevated call skew and euphoria, dispersion/correlation at extremes — a culprit starts the move, but the cascade feeds itself due to market maker hedger flows adjusting positioning as people unwind calls and buy extreme amount of puts.
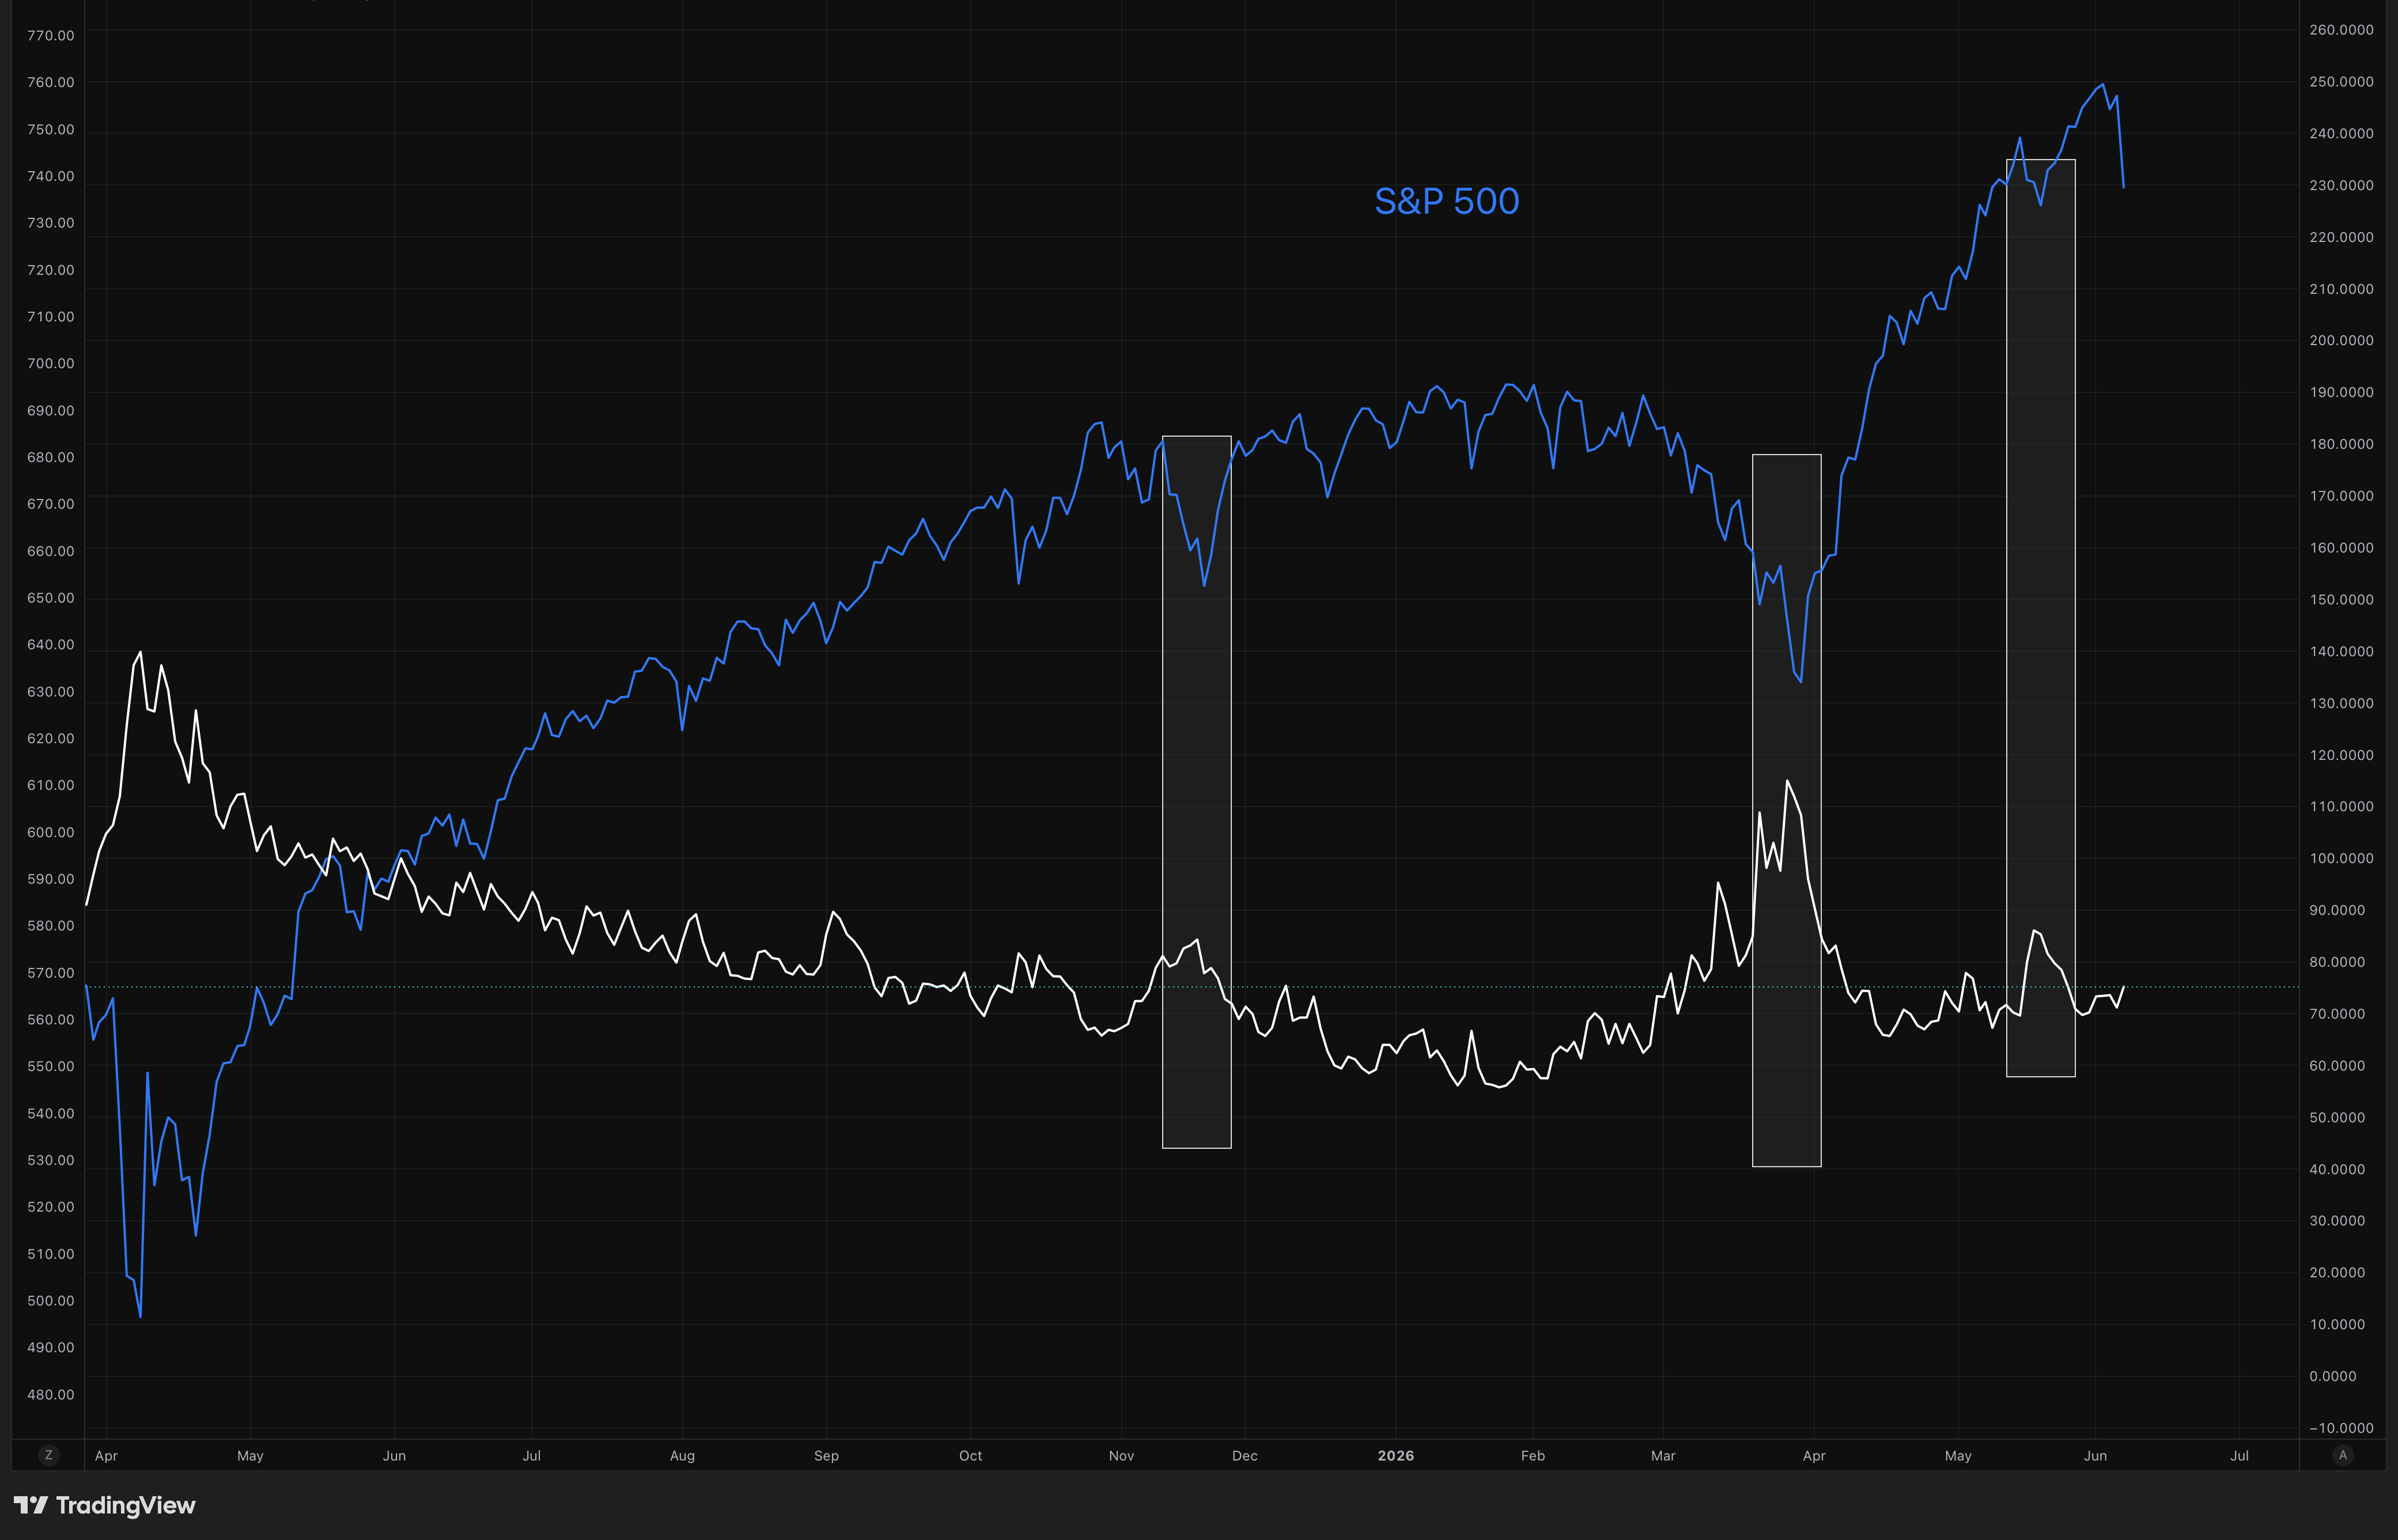
Breadth Almost Neutral
Breadth is steadily declining, we have bounced in breadth but those bounces have not materialized in an up trending breadth trend.
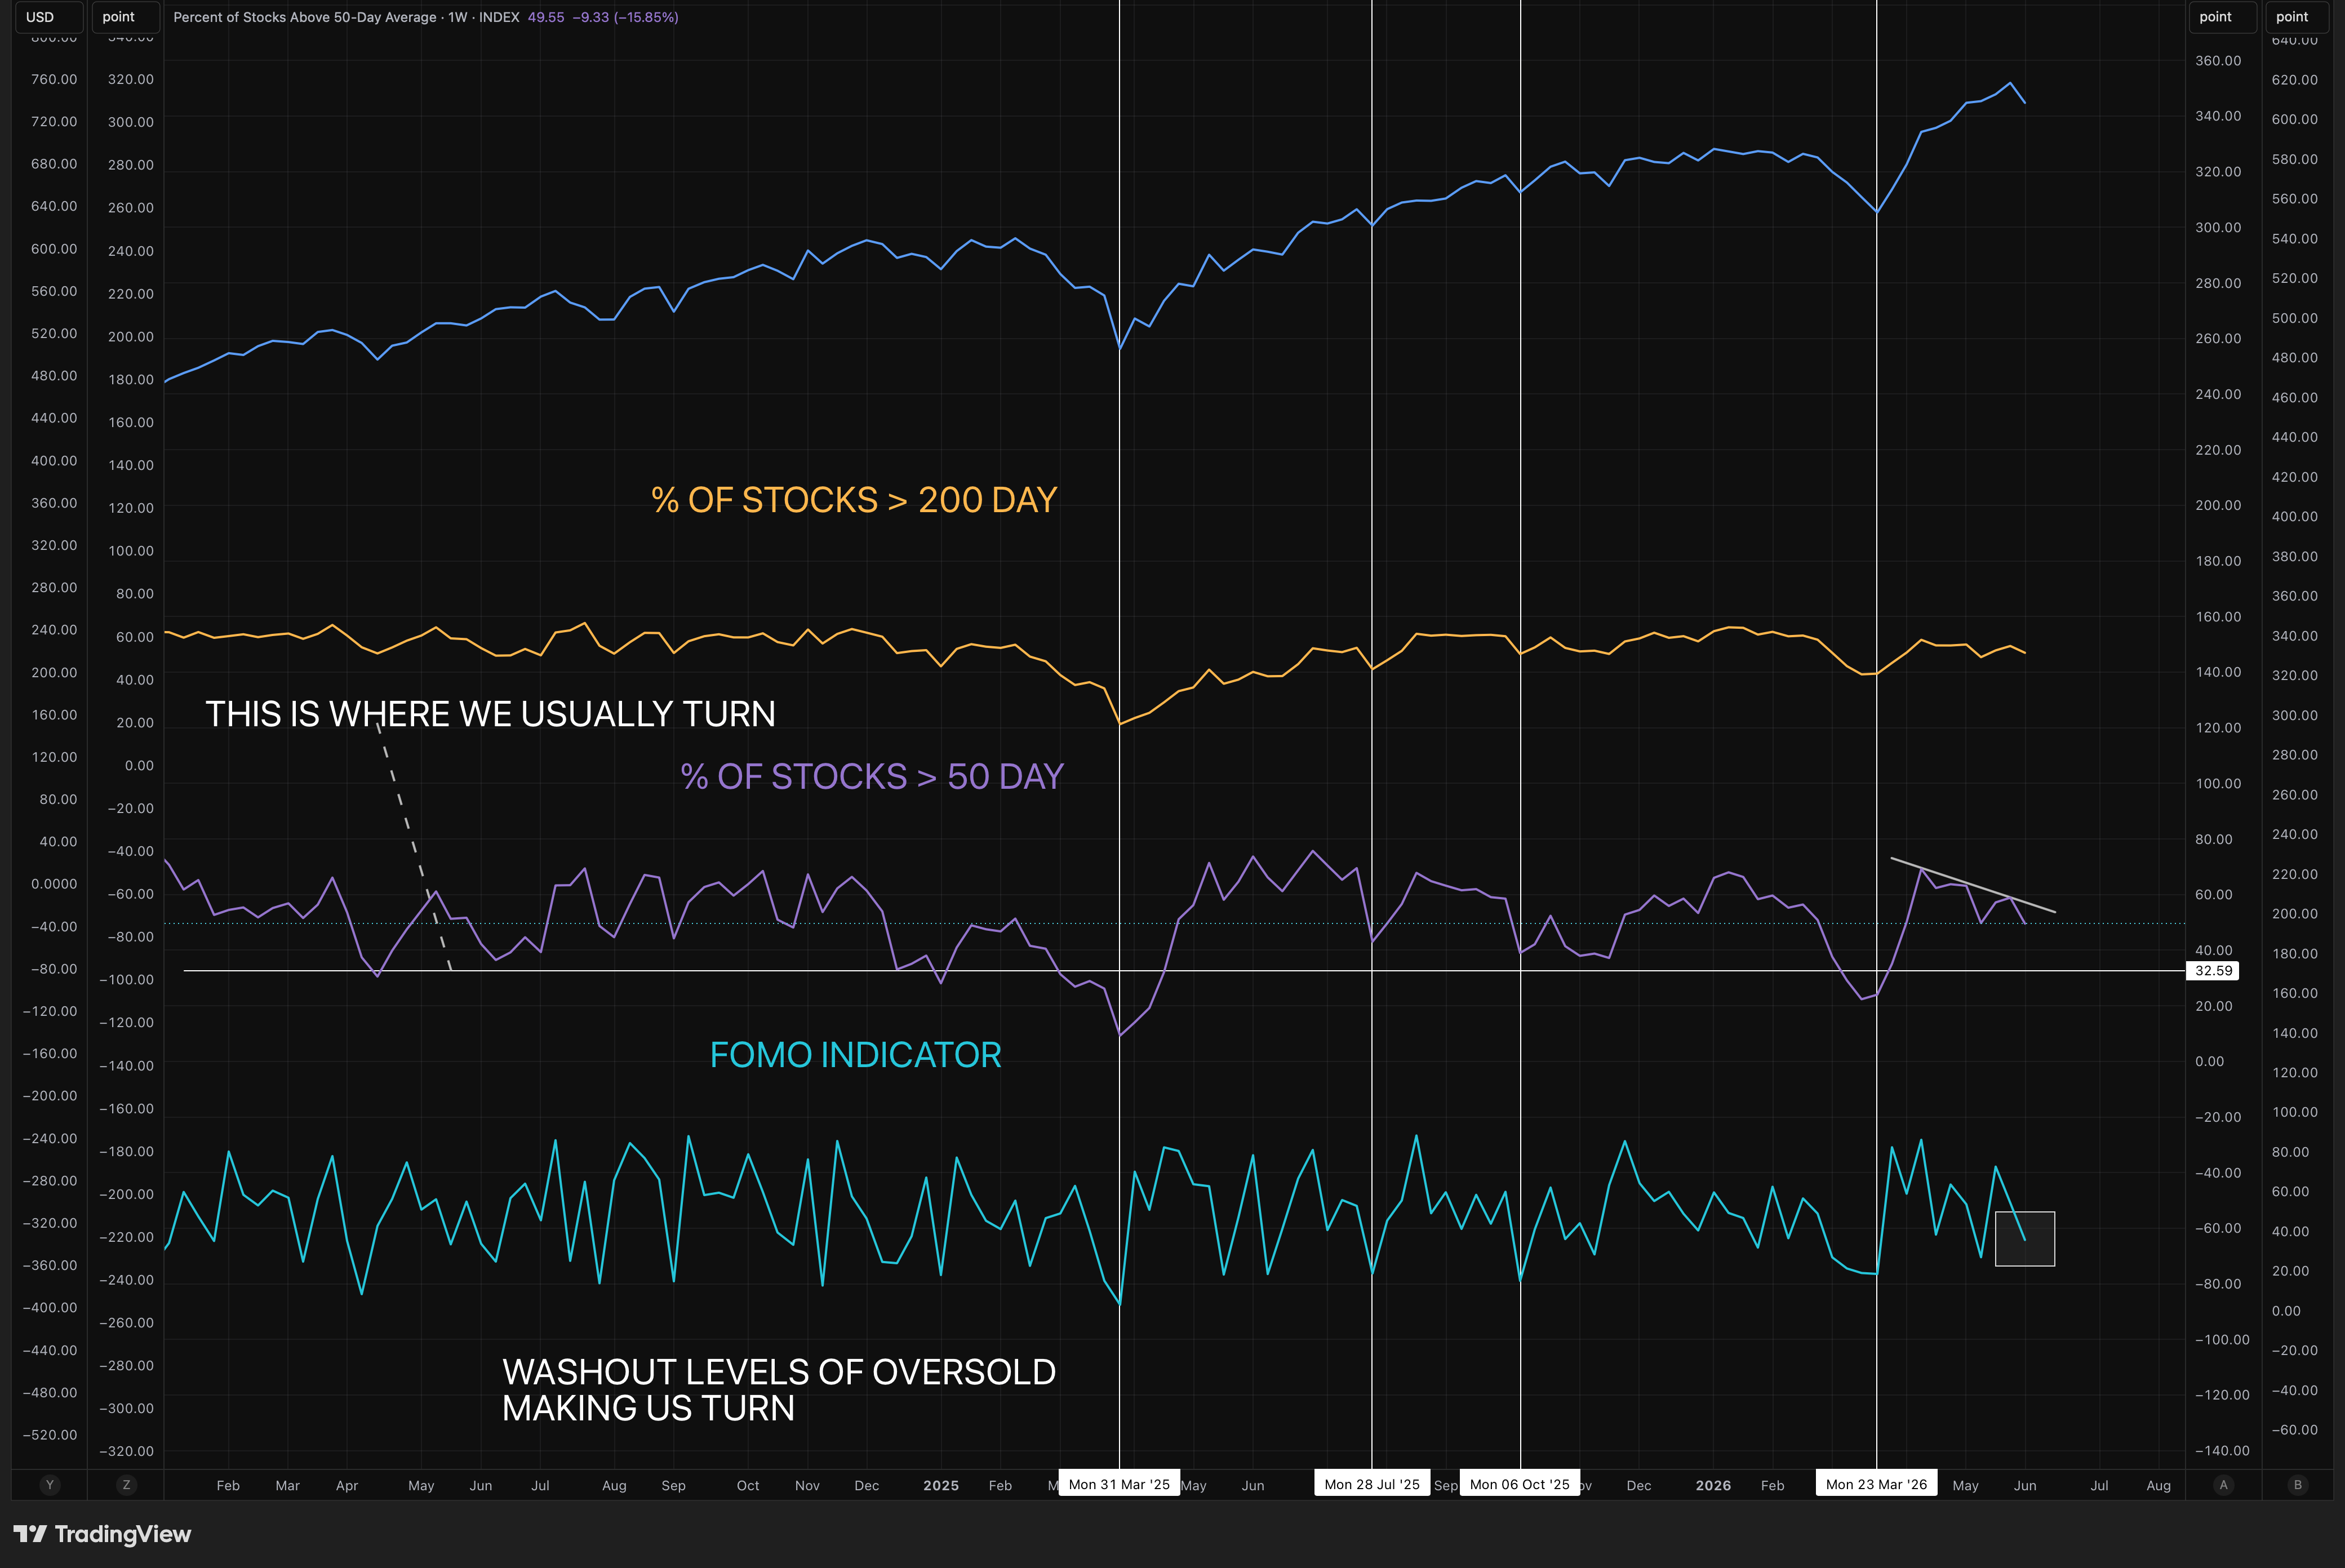
Summarizing where we stand:
Longterm breadth is declining but not oversold
Interemdiate term breadth is declining but not close to oversold levels where we usually turn in sustained weakness during bull markets
FOMO indicator is getting oversold but not at washout levels yet
We will get no mechanical buying from breadth, if we get some more weakness that will push us down to interesting levels, where going long if price action is supportive will provide very good risk reward.
But we are not there yet.
Nobody Looks At Up/Down Volume
I find it to be excellent information, Nasdaq up/down volume is a market-breadth indicator that compares the trading volume in Nasdaq-listed stocks that are rising with the volume in Nasdaq-listed stocks that are falling.
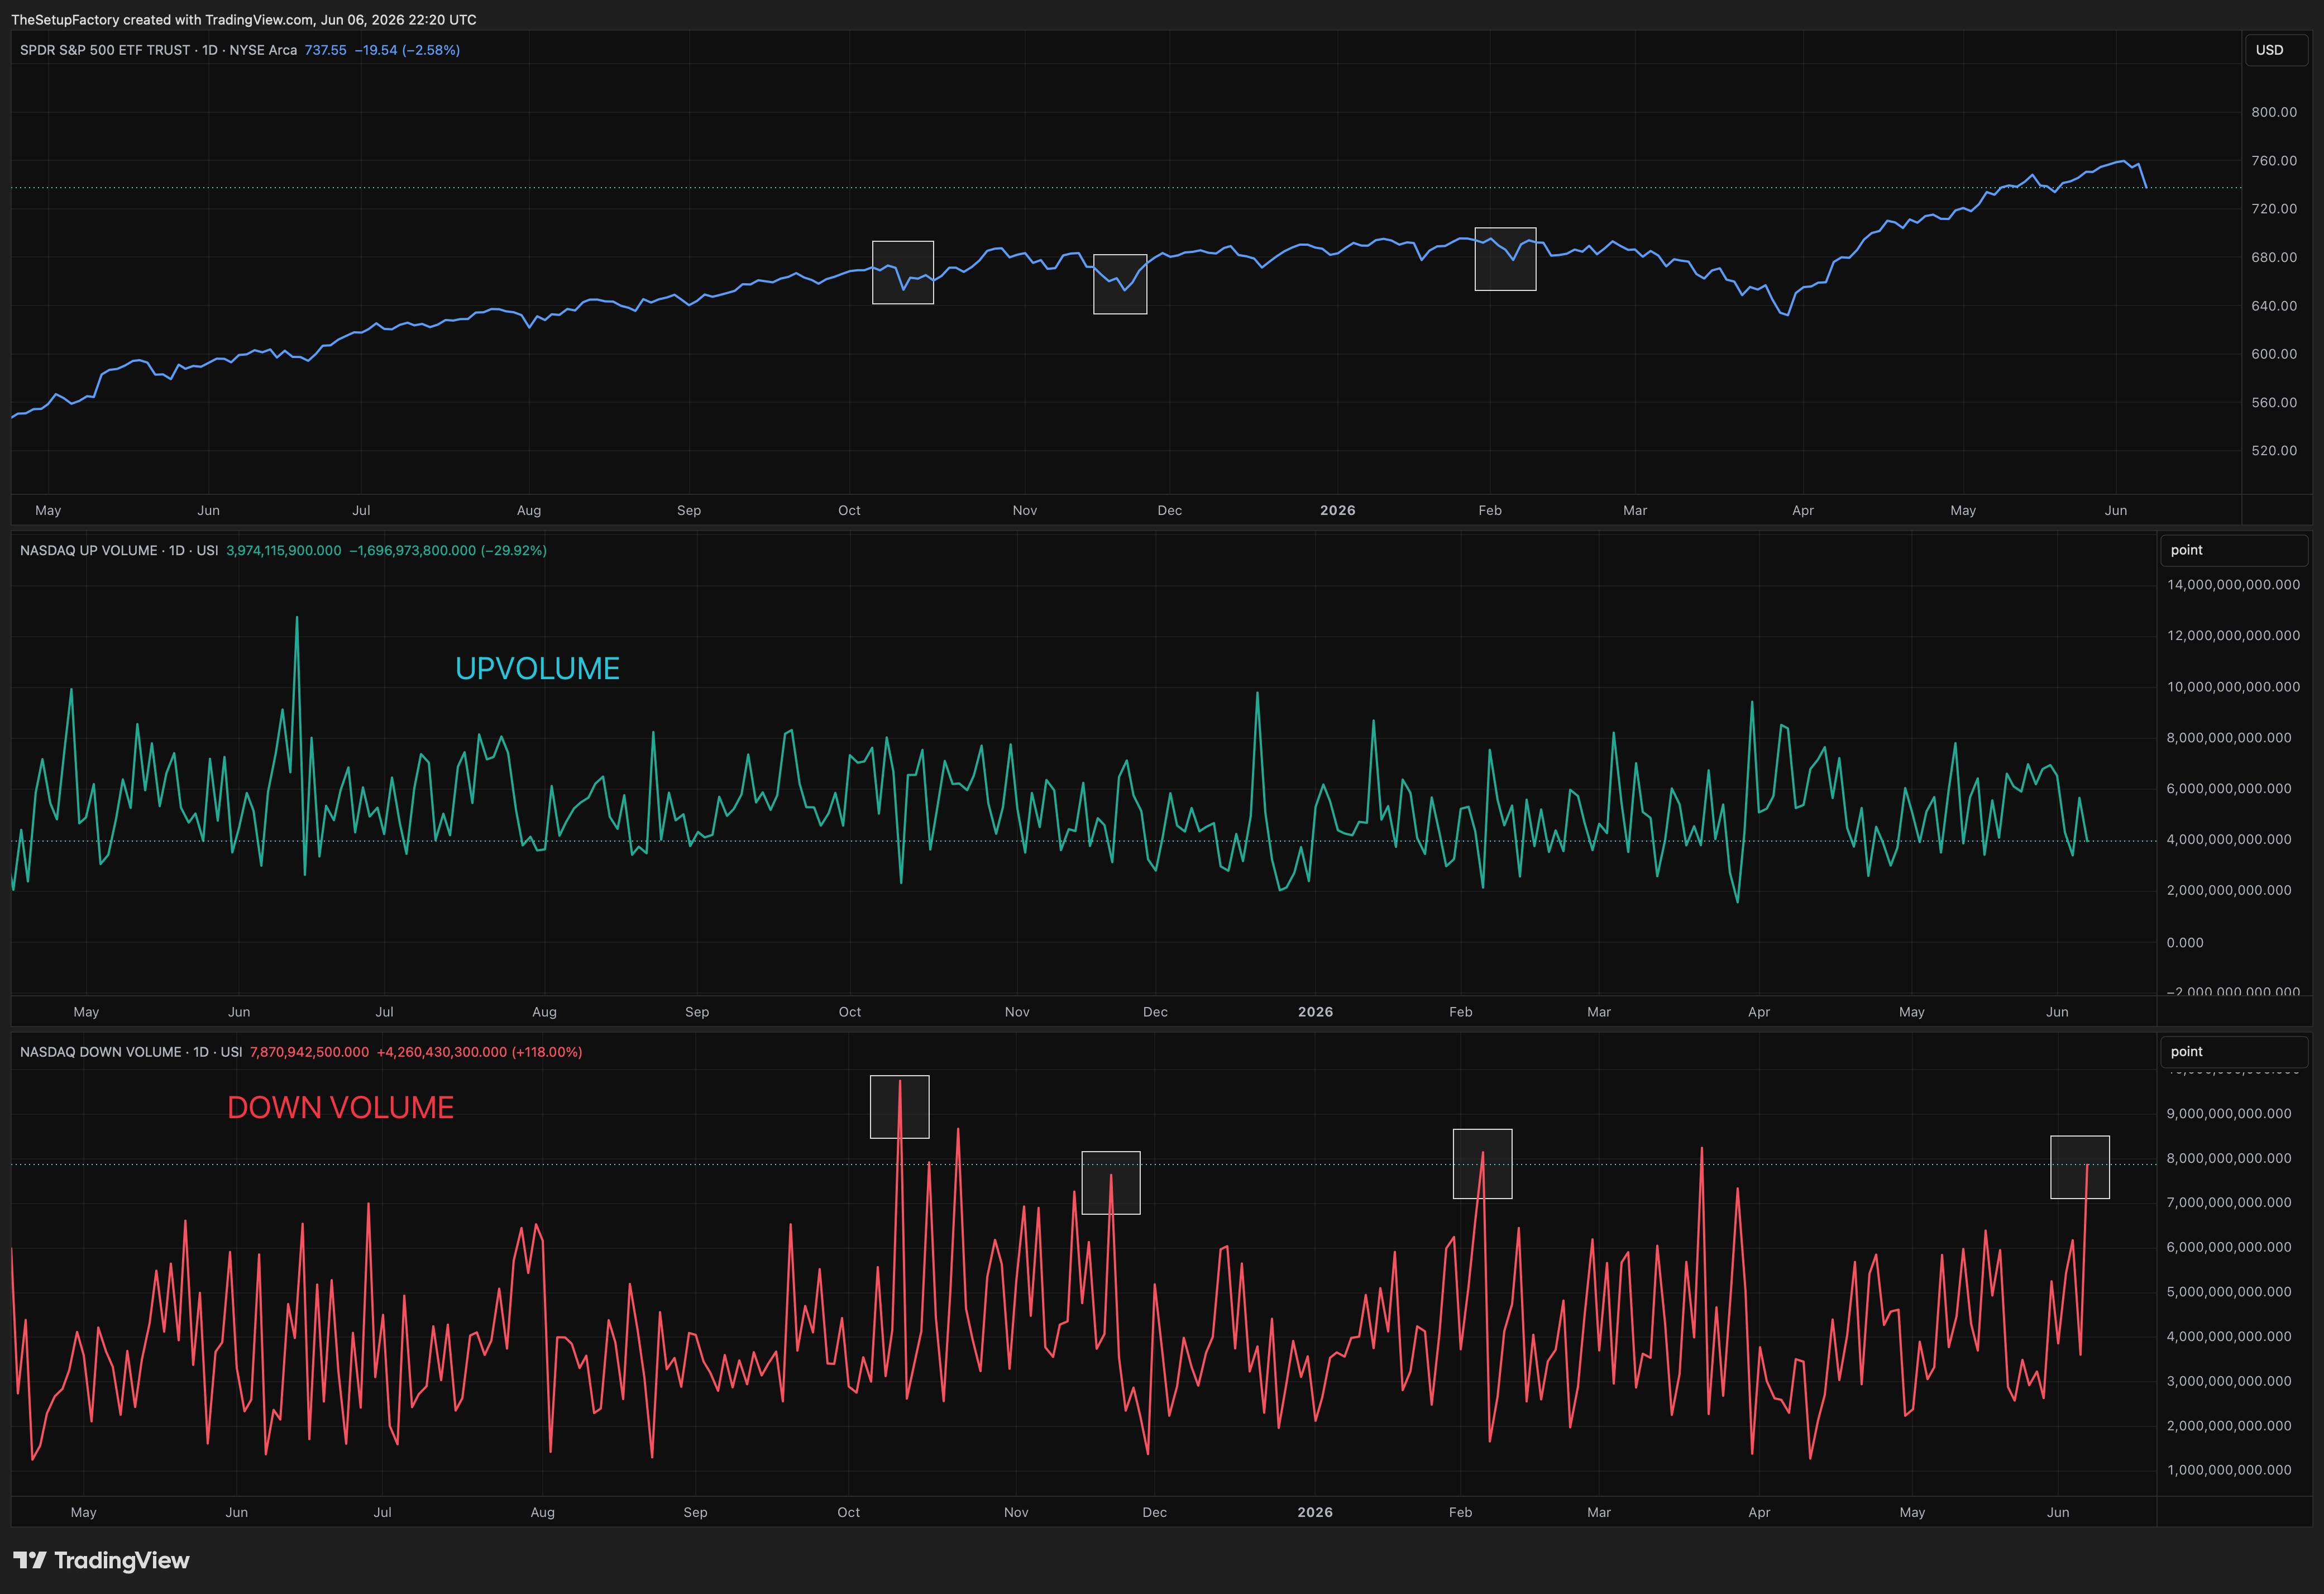
And here we have some good news and bad news. The bad news is that this is the first real spike in down volume, distribution style down volume. It can be the start of choppy times.
The good news is when in an uptrend, the market often finds a turn soon when we get this significant down volume.
VIX
VIX made a huge move, 40% up and closed above 20, volatility complex is in expansion mode, which always makes the market more unstable until things settle.
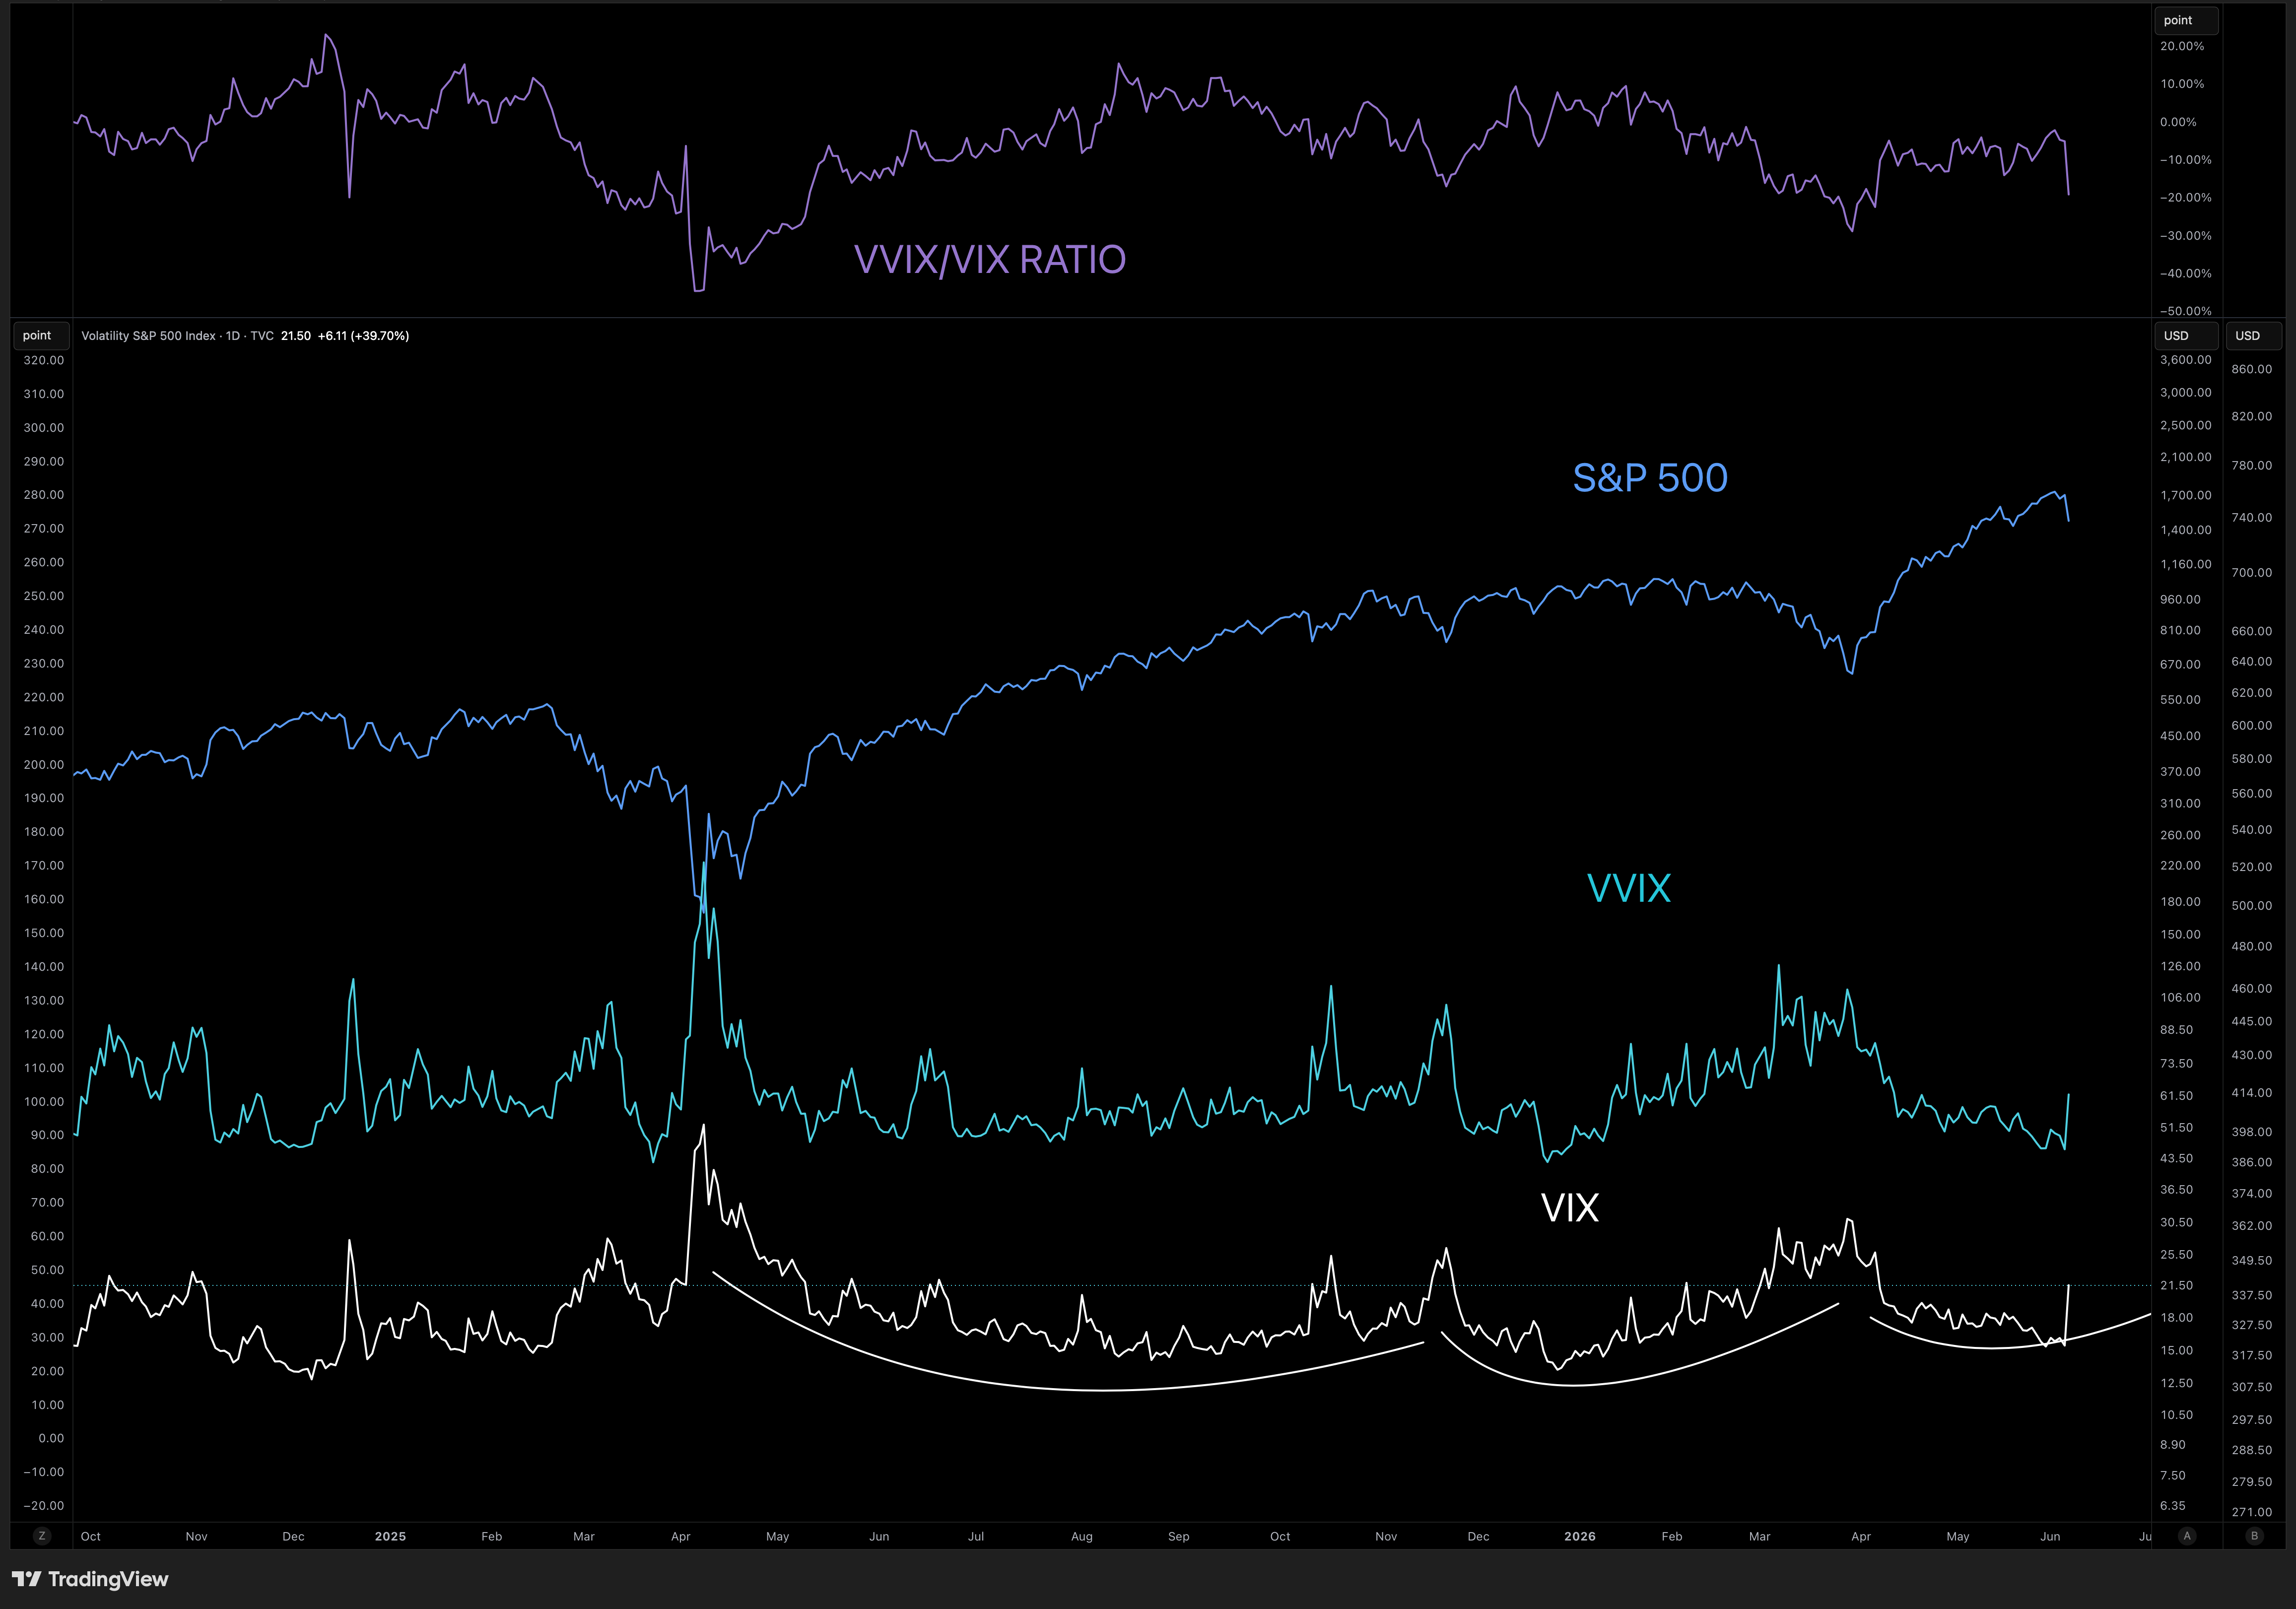
We also saw a sharp move up in VVIX, the implied volatility of VIX itself. we see both shorter term hedging and longer term hedging.
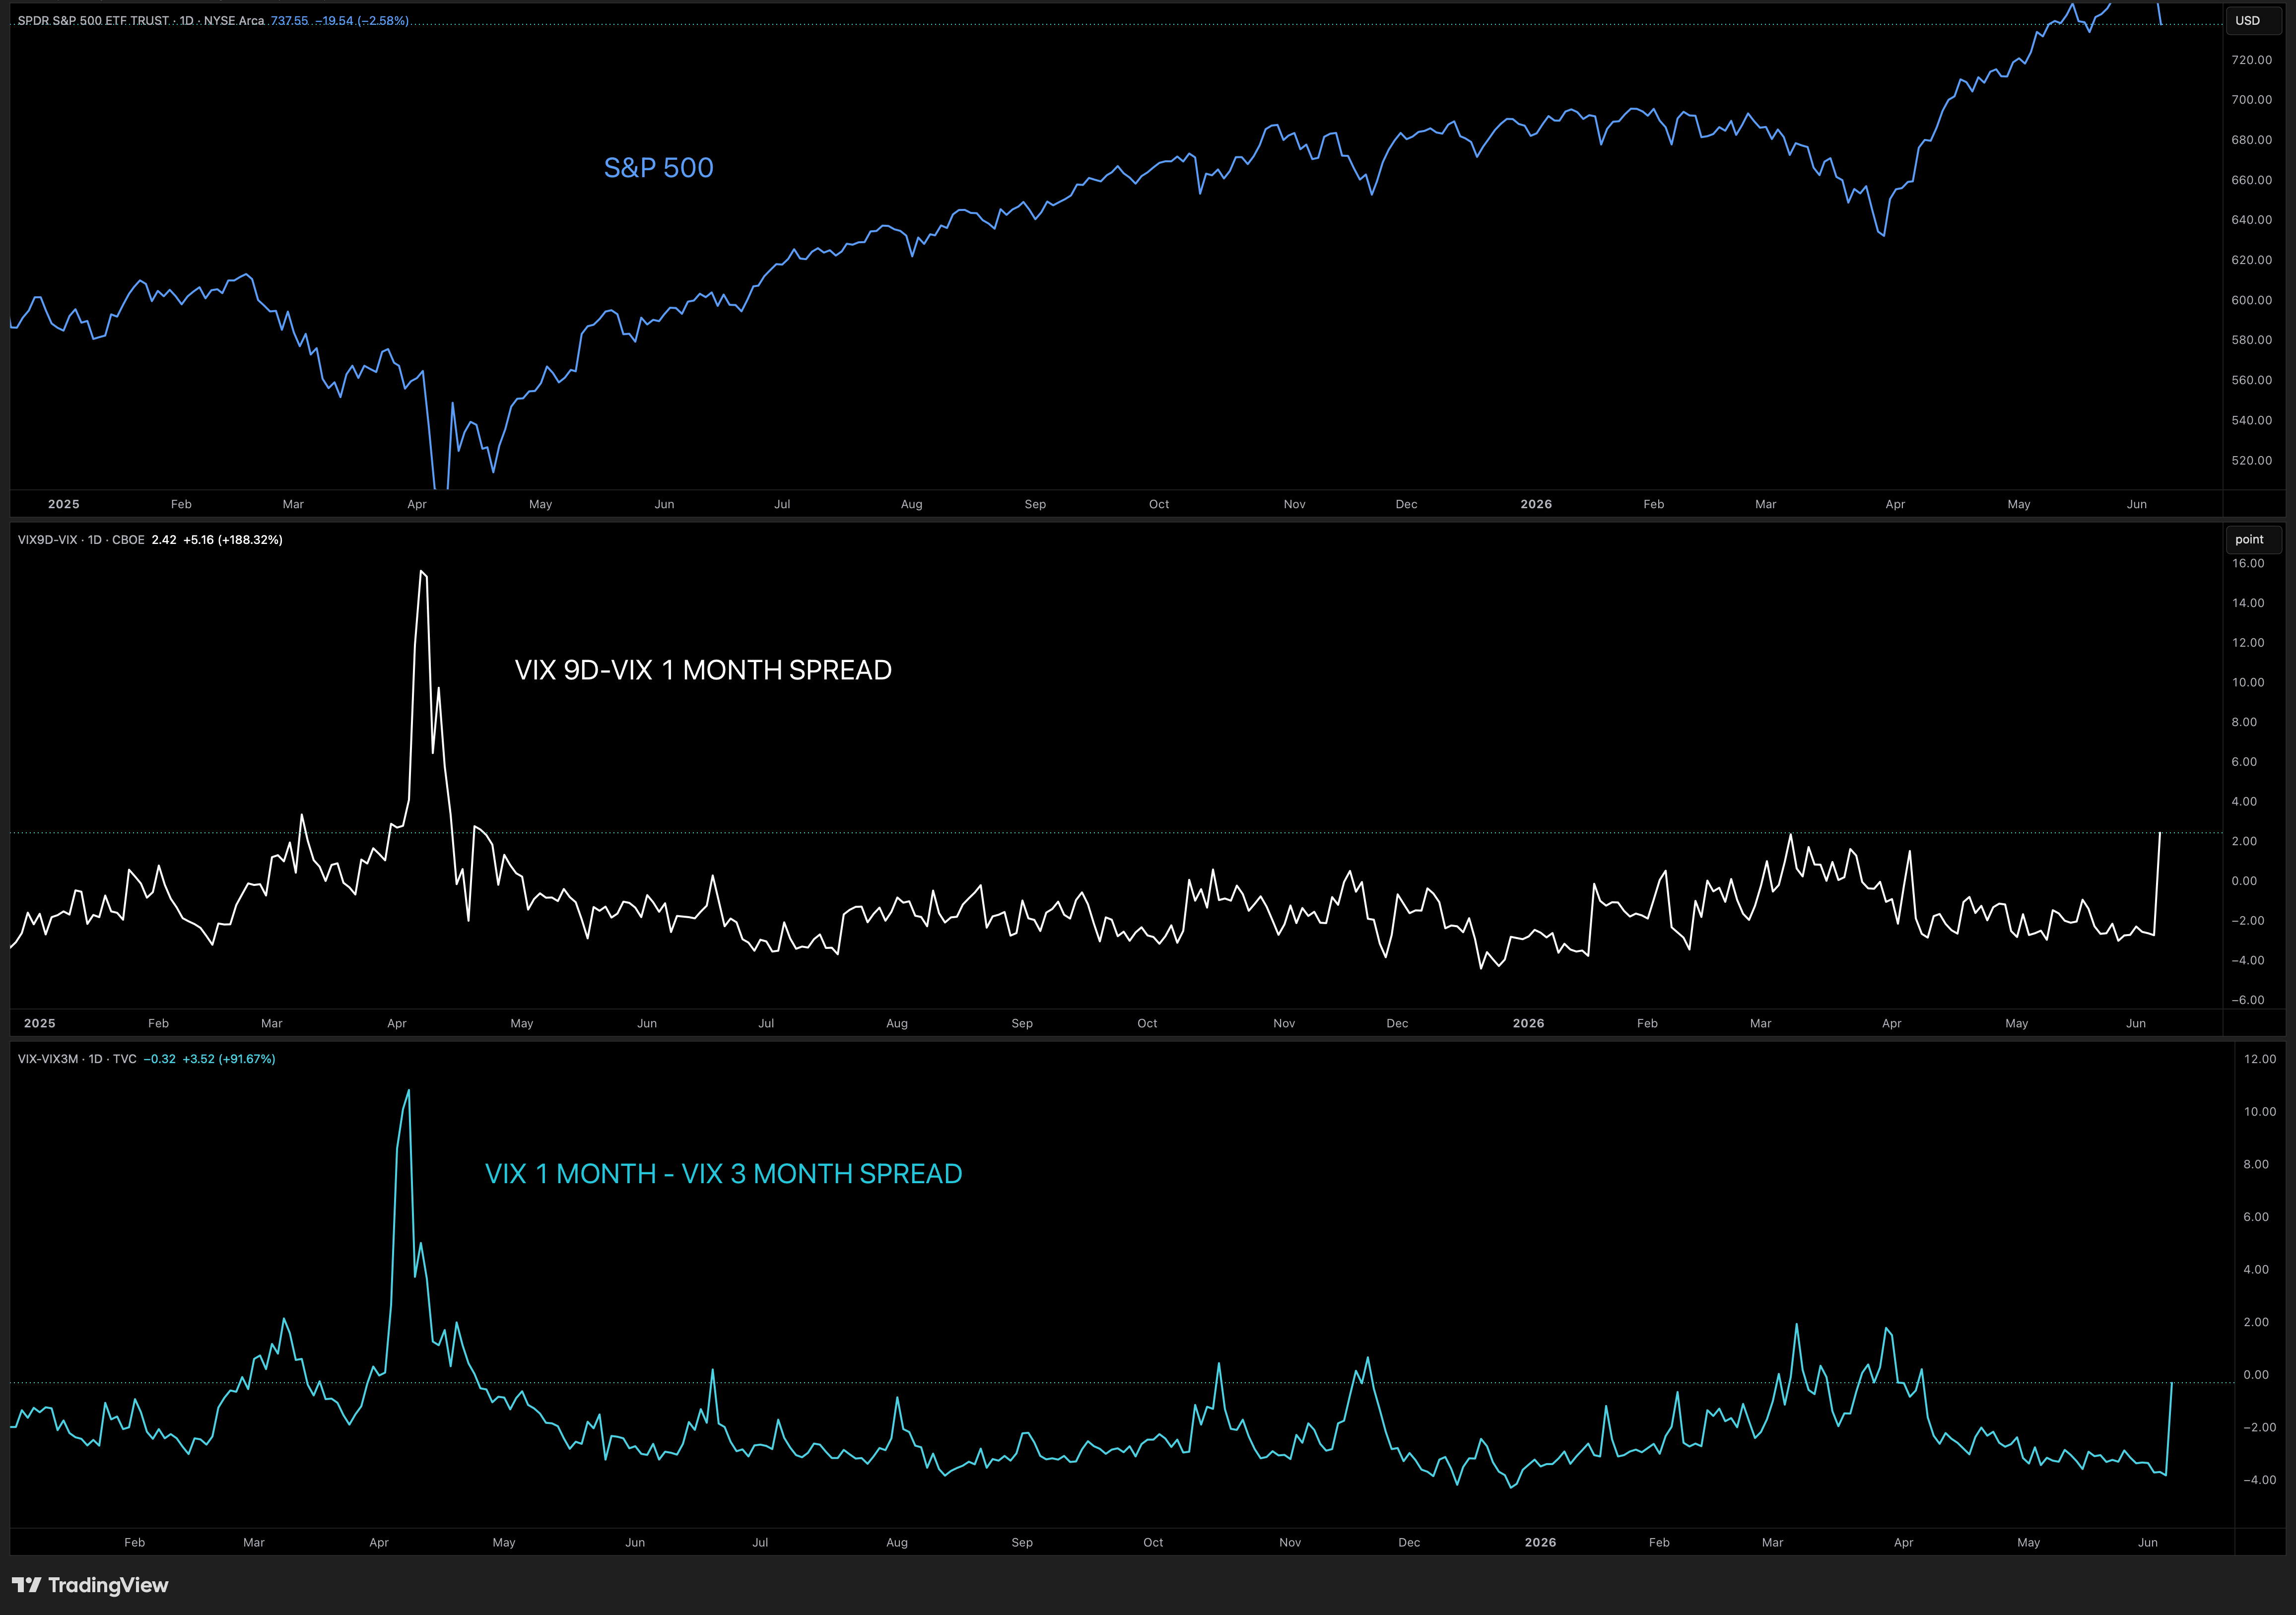
But clear overweight into a short term hedging vol event, and this matters because it will shape how VIX might behave going forward.
Shorter term vol expansion settle faster, than sustained vol expansion, we need more information but lets hope it’s the shorter one.
We are not yet at levels of VIX or cracks in VIX term structure where we put in a reliable low, but another significant vol spike might do the trick.
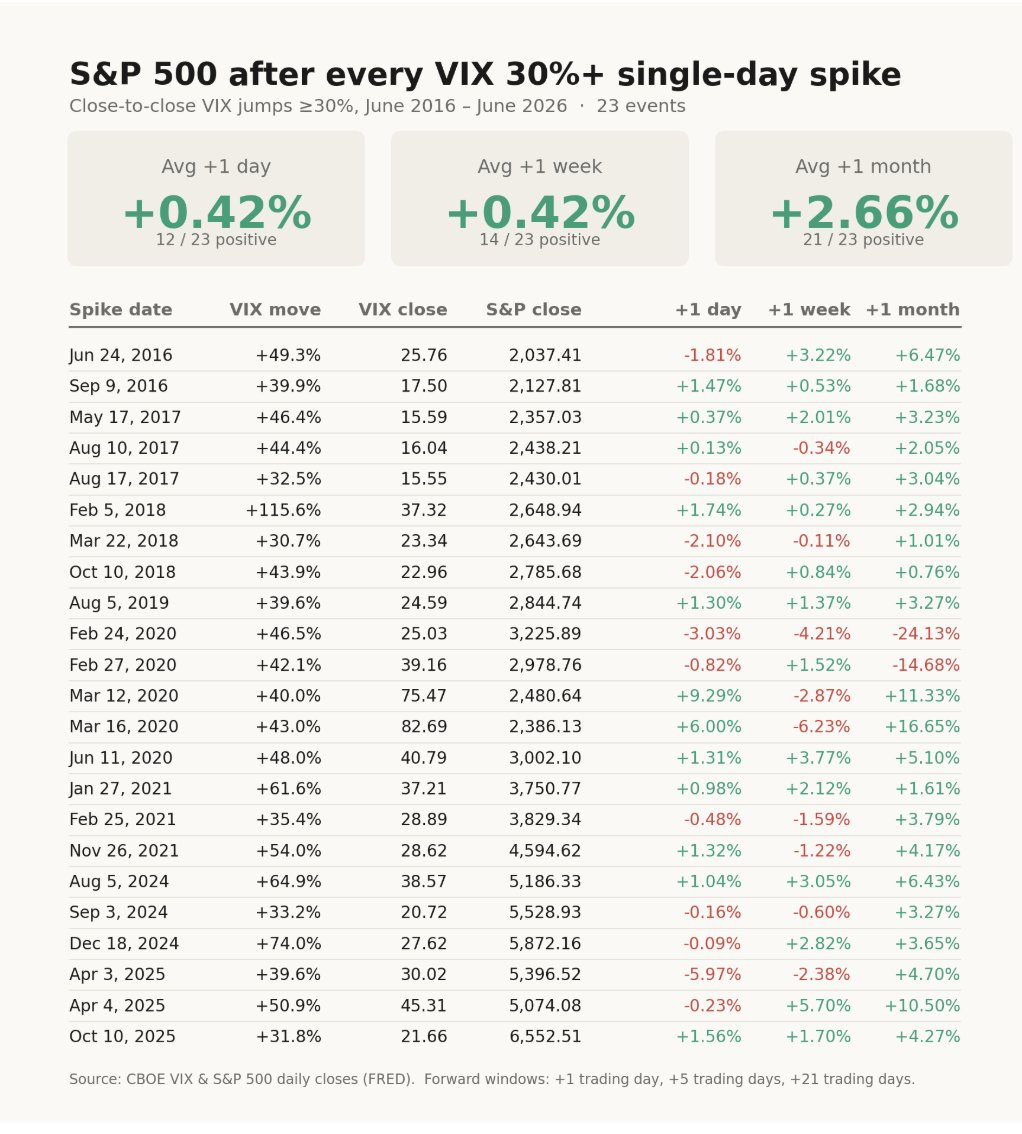
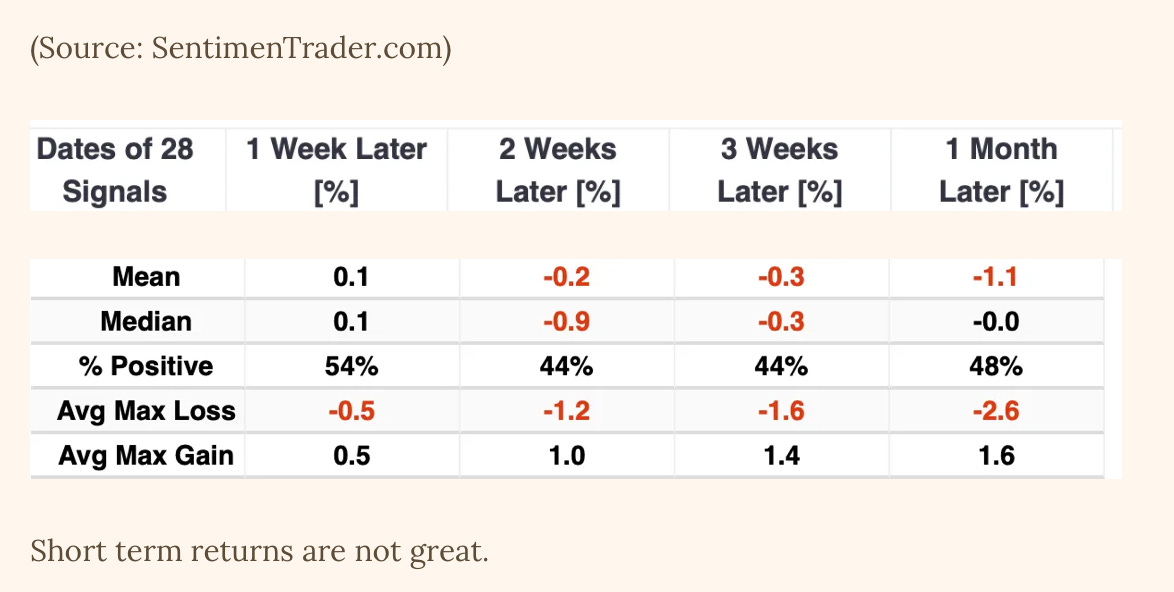
And VIX spikes are not a buy signal, but they suggest panic is getting close, which often makes the market turn. Here are how history tells us price behaves after a 30% vol expansion in one day.
Usually favorable short term with some ugly outliers.
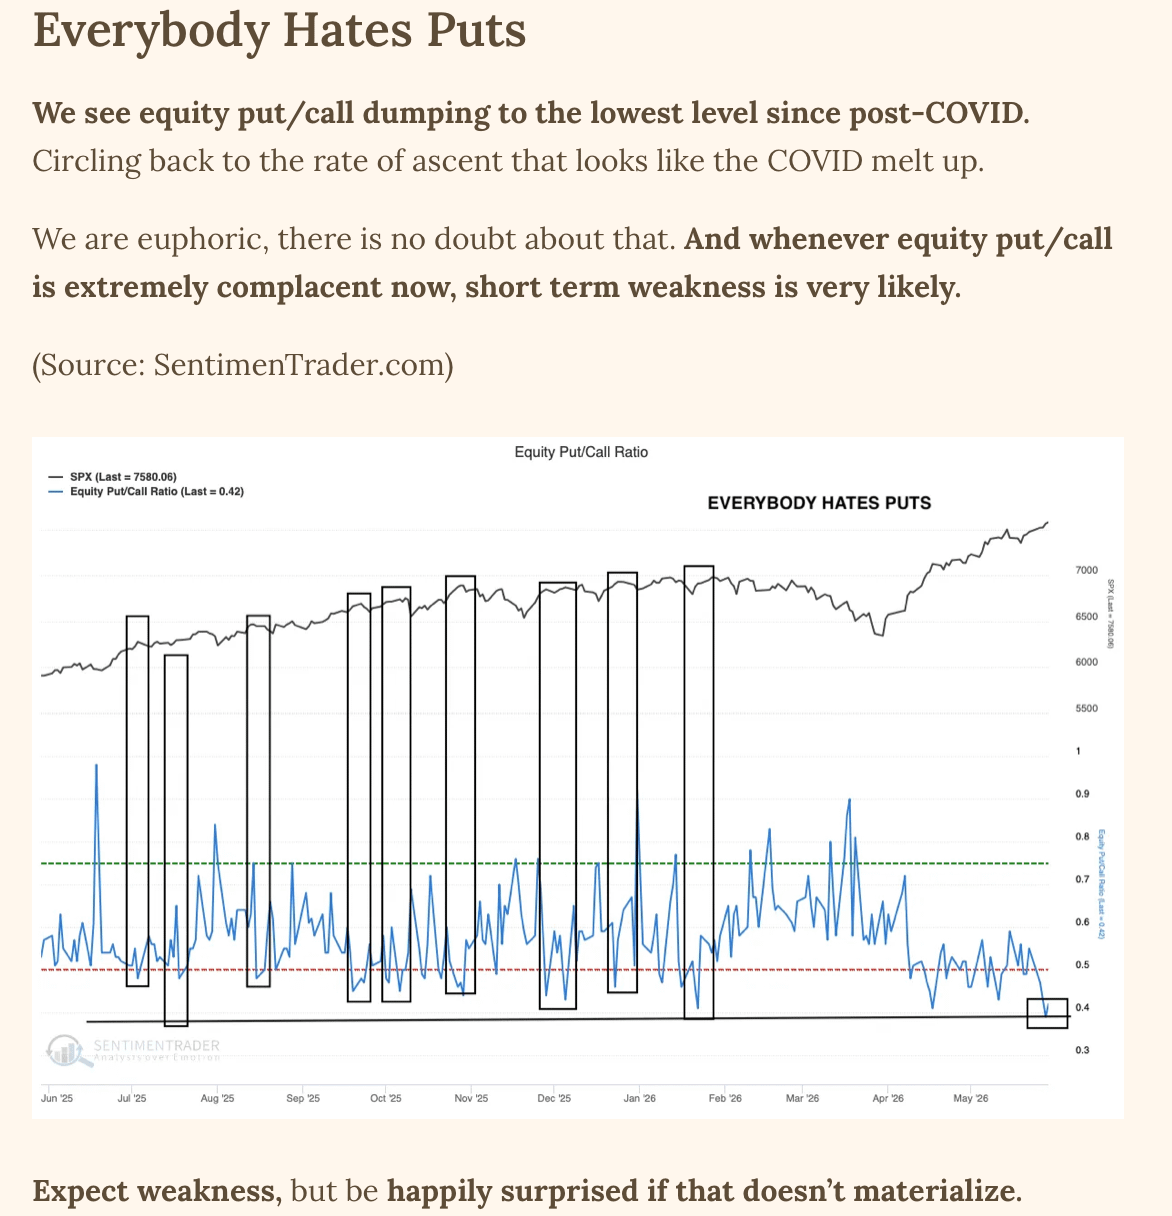
Large Amounts Of Puts Being Bought
We see a spike in equity put/call, it is not sufficiently high to provide a low to trust, but this is solid hedging which is good.
(Source: SentimenTrader.com)
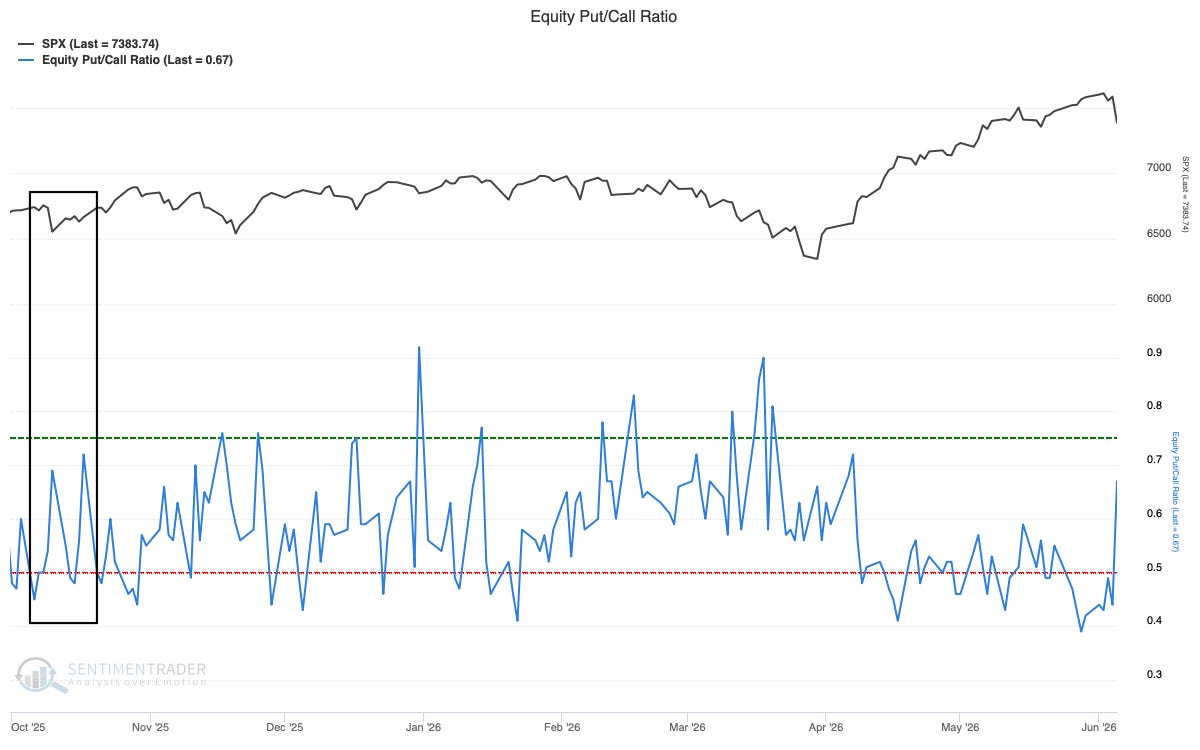
And what we often get is a first spike like this, followed by a higher one which truly marks the low. Good that some fear entered the building, it makes the turn closer.
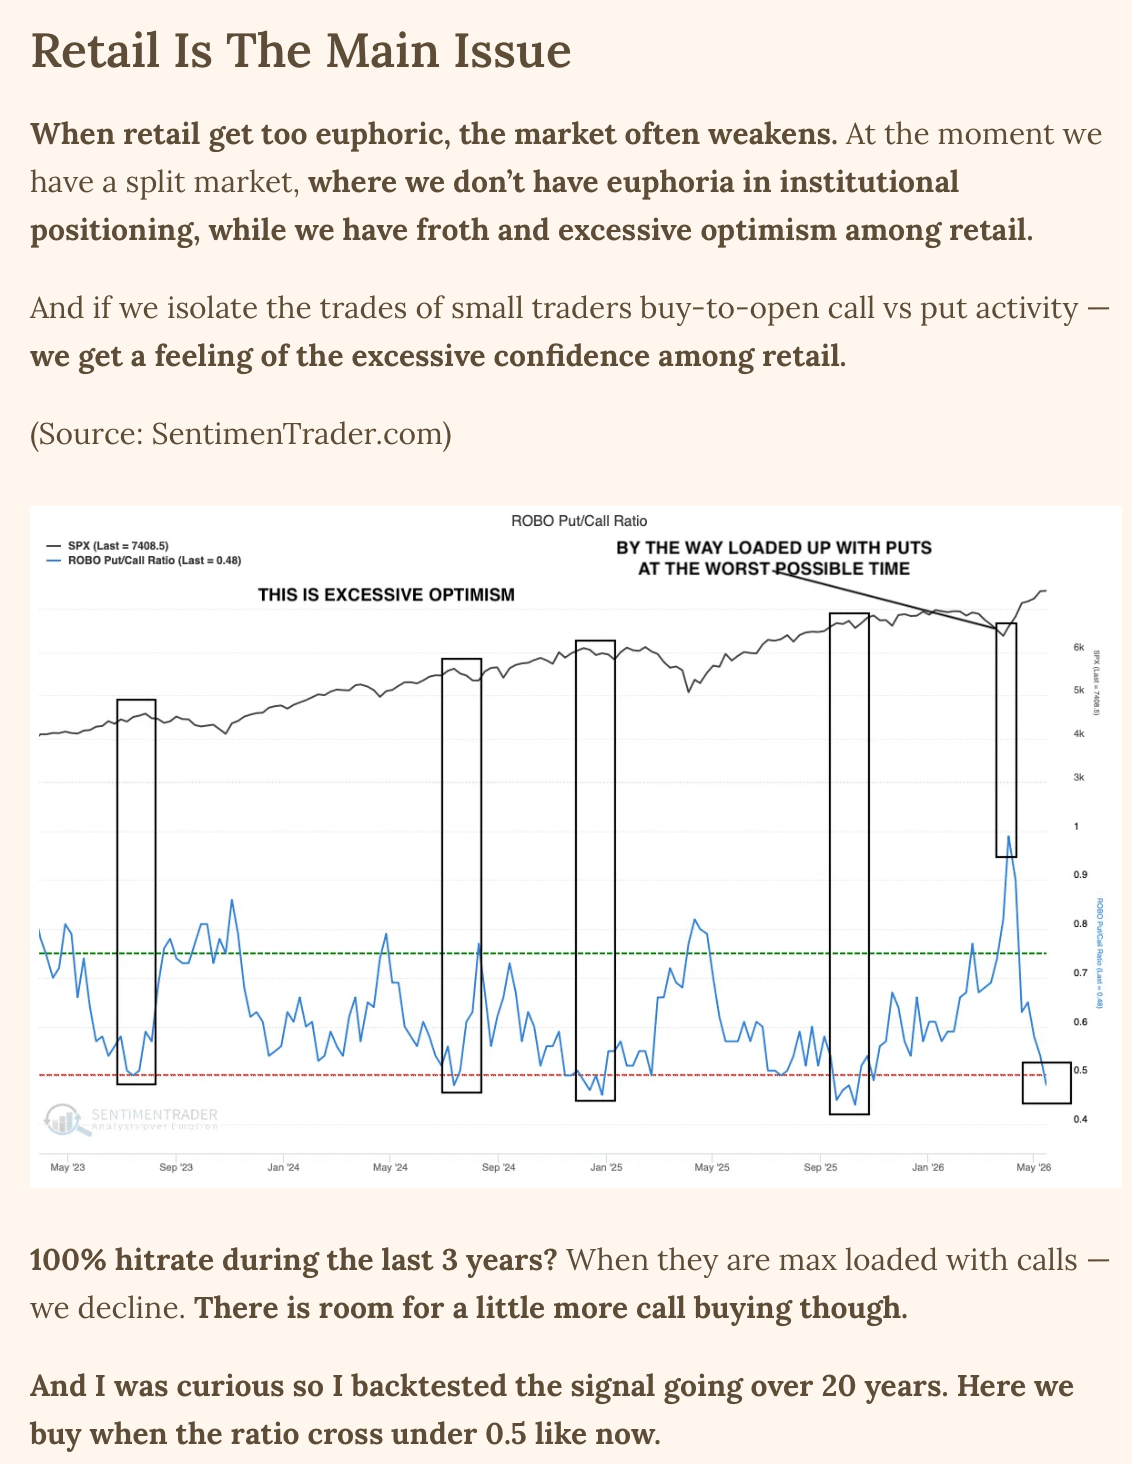
We Also See Retail Buying Puts
This is good, ISE call/put is designed to filter out institutional order flow, and shows us retail activity better.
Whenever they are excessively put heavy, the market likes to turn soon.
(Source: SentimenTrader.com)
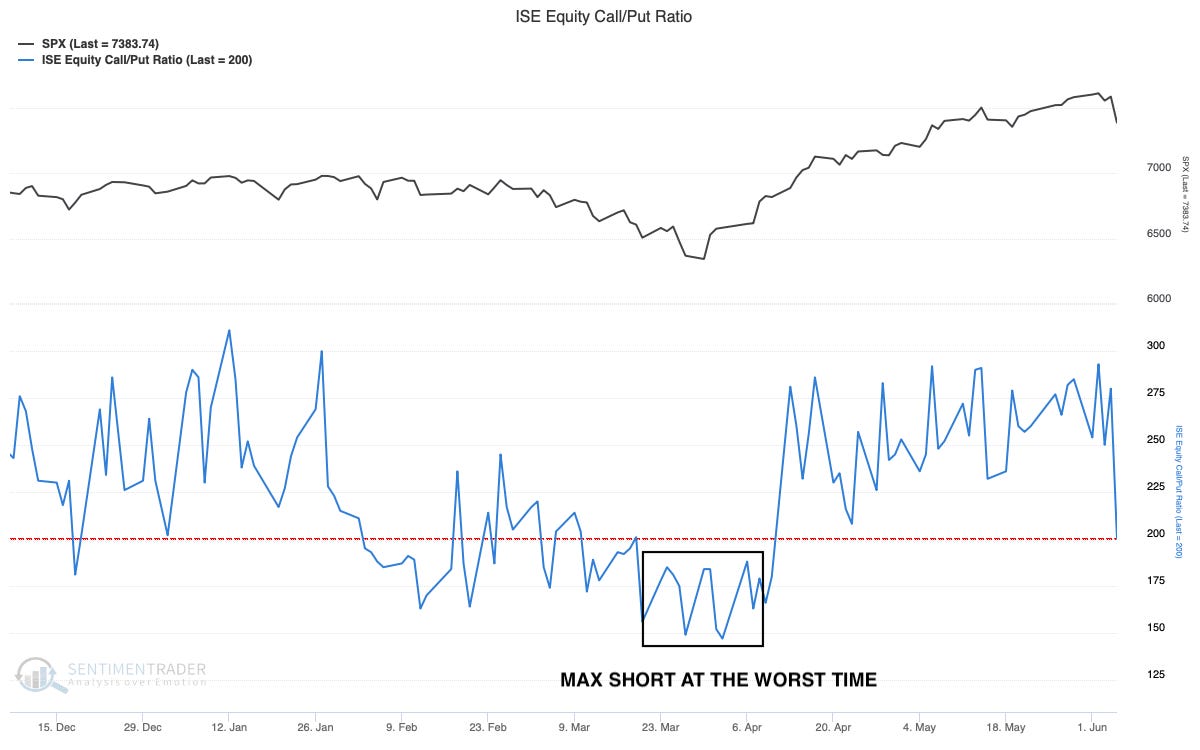
Still not capitulation levels of fear here, but a very good start. A little more scary weakness might do the trick.
But retail both this chart above as well as this chart below, shows us that retail is buying heavy into this dip. And that is not ideal, real fear is not here.
My friend YGTT showed me this great thing to monitor, showing the largest number of orders by retail customers on Fidelity viewed as buy/sell.
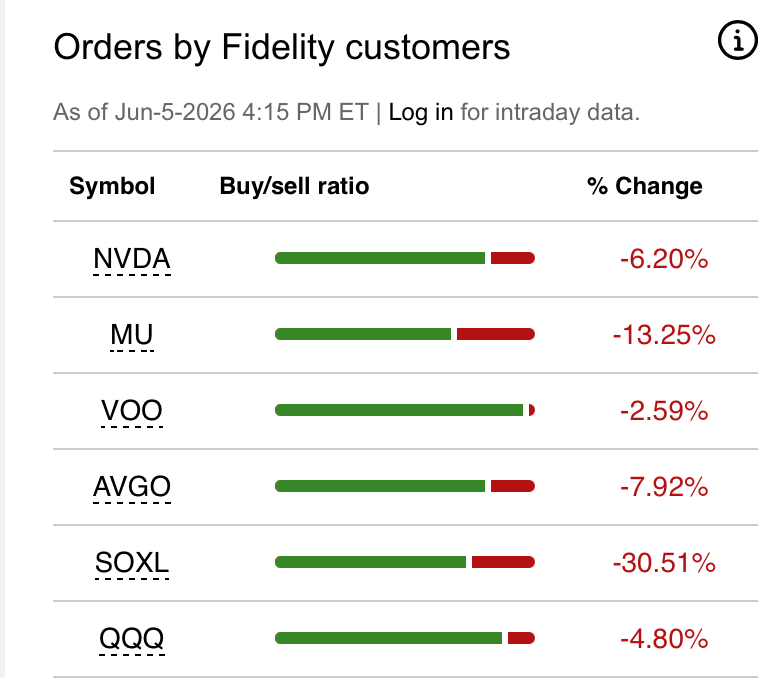
They are buying with both hands, SOXL is the most worrying one. Hard to see us not shaking out these early buyers before turning, sentiment is far from washed out.
SPY Optix Tells Us A Bounce Is Close
SPY optix is a composite indicator that takes into account options positioning, price behavior, future volatility expectations and more. And it is a good thing monitor when looking for a turn short term.
Every indicator can fail, but when SPY optix becomes this oversold, a turn is normally close.
(Source: SentimenTrader.com)
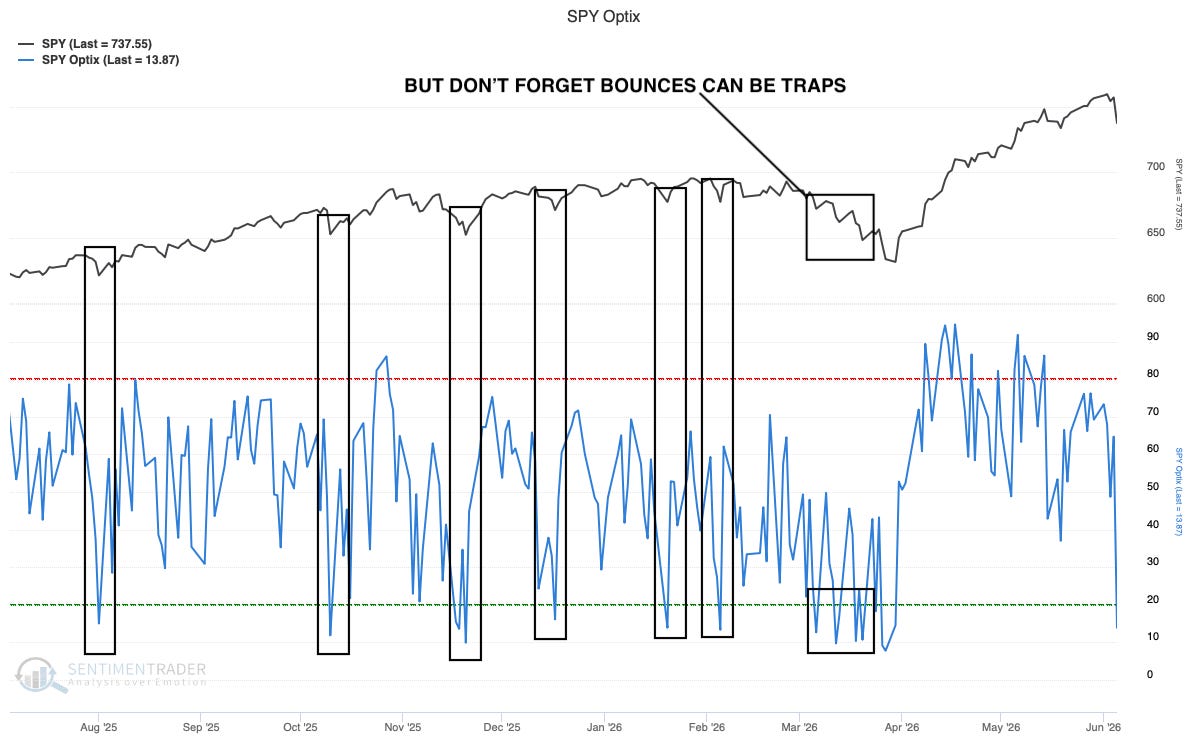
And here is the thing to really focus on, a bounce means very little — it is expected. What happens after is what matters, it is important to not be fooled by the first mechanical rebound — and that rebound can be strong and lock out many out.
Sometimes it’s the real turn and sometimes it’s a trap. If we bounce, I recommend letting current trades run and study price action until things settle before taking on new exposure.
Because When The Regime Changes And There Is Also Structural Weakness In The Market
We should listen, we have had several Hindenburg omens, they can be cancelled if we get a strong rebound.
But they are still there, and the NYSE Titanicburg indicator merges the Hindenburg signals, with a similar titanic syndrome sign. It is essentially a market where we are at highs, but we see a jump in weakness with many stocks producing new 52 lows.
A split market — and a split market is never completely healthy.
(Source: SentimenTrader.com)
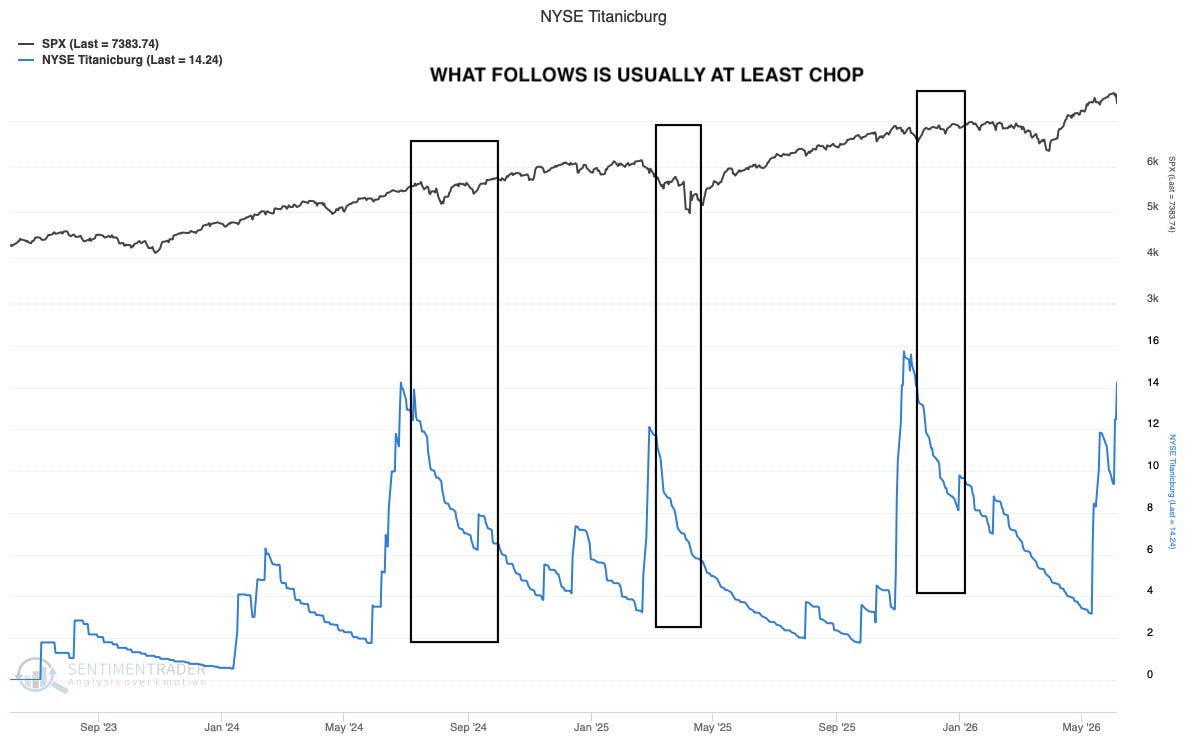
And a split market must chop around to either mend or dump. This doesn’t always result in a significant decline, but very often to some kind of consolidation and choppy conditions.
And if we zoom out, after 9 straight weeks up — is that really surprising?
But we need a normalization of the market conditions and breadth to improve while we consolidate, otherwise it’s a clear warning sign.
What Happens On Monday’s After A Friday Like That?
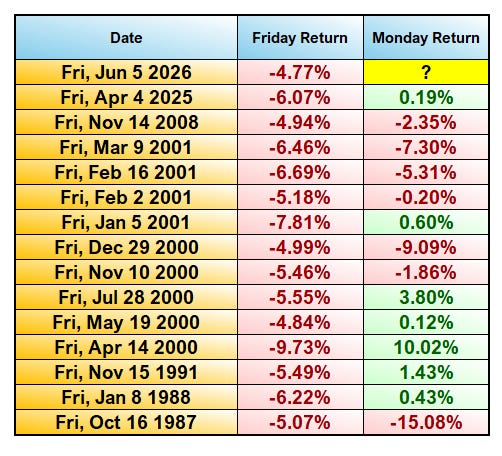
Mixed.
But Interestingly The S&P 500 Has Never Peaked In June
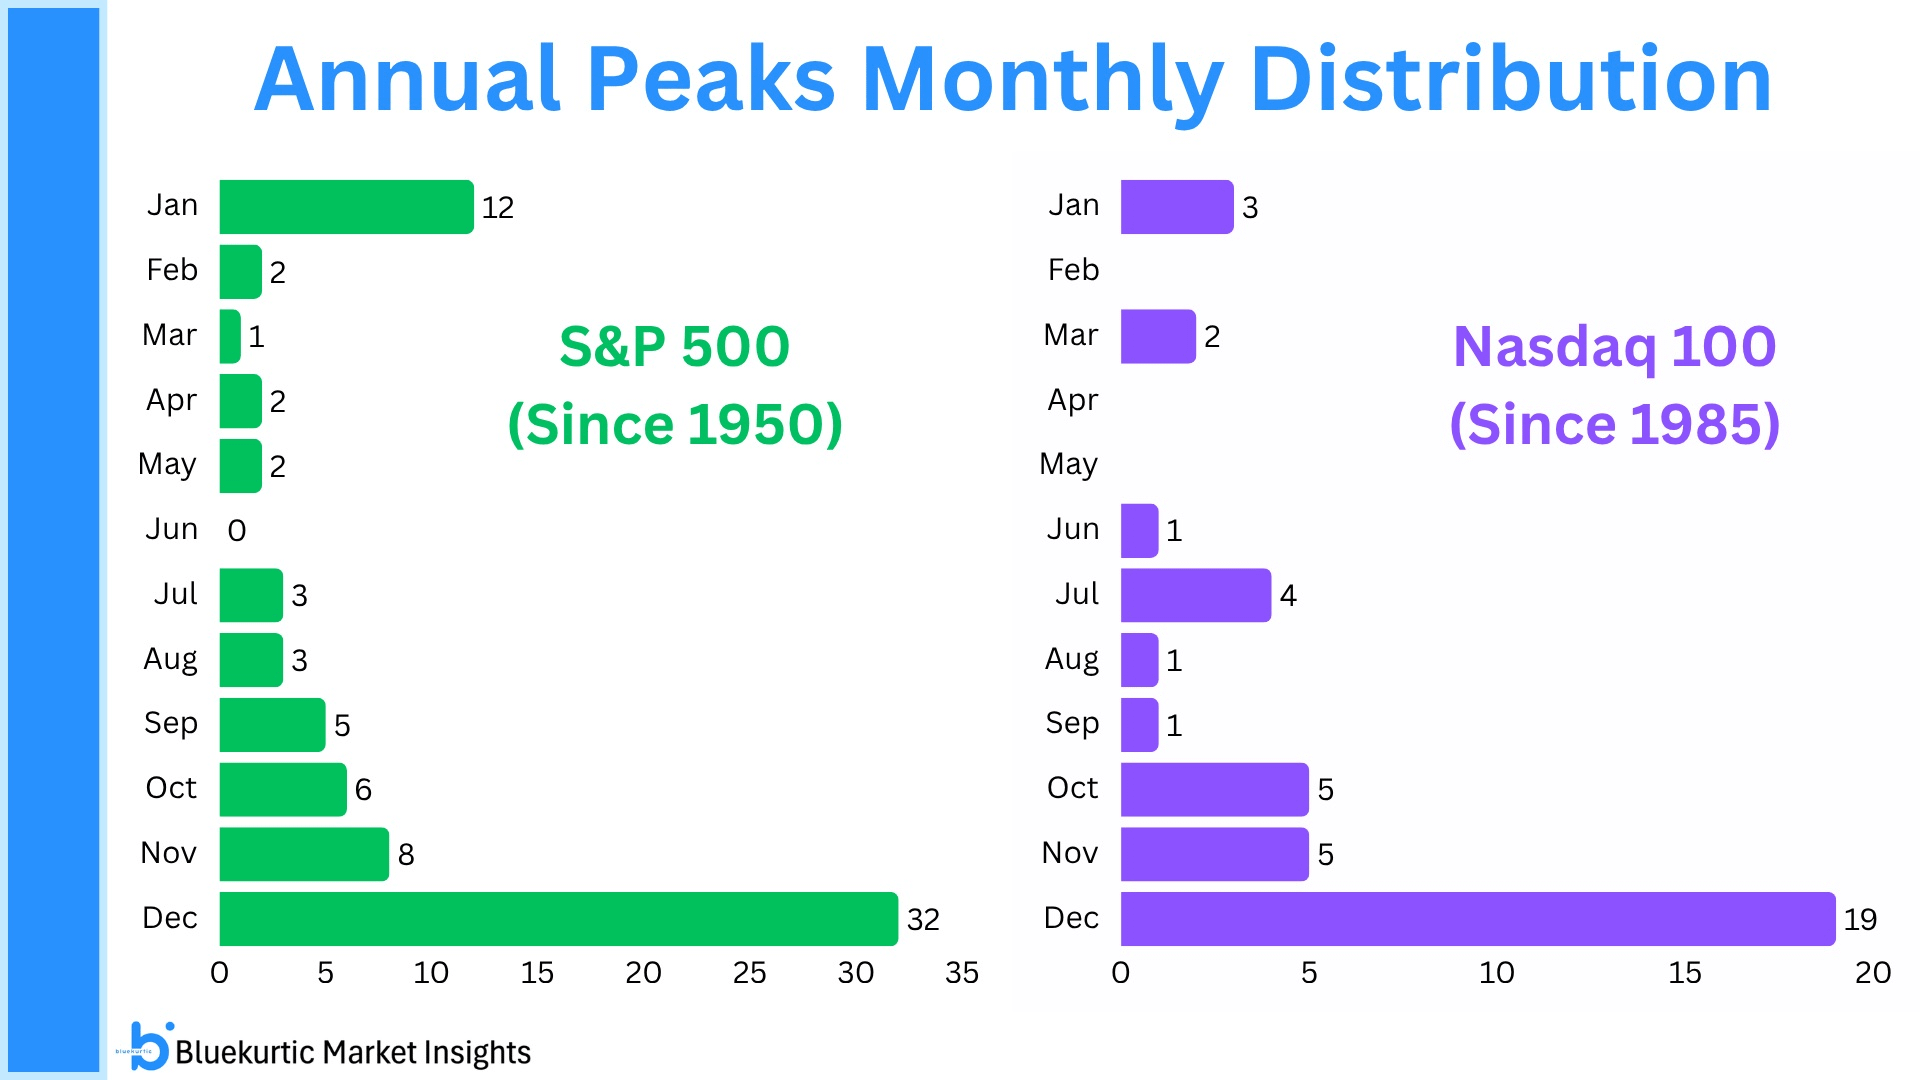
Since 1950. Not a single time. That is an incredible stat, lets hope it sticks.
Some Important Charts
The Semis Are Fine
Yes, that was a brutal move, and moves like those will lead to multi week base building at least.
But they were very extended.
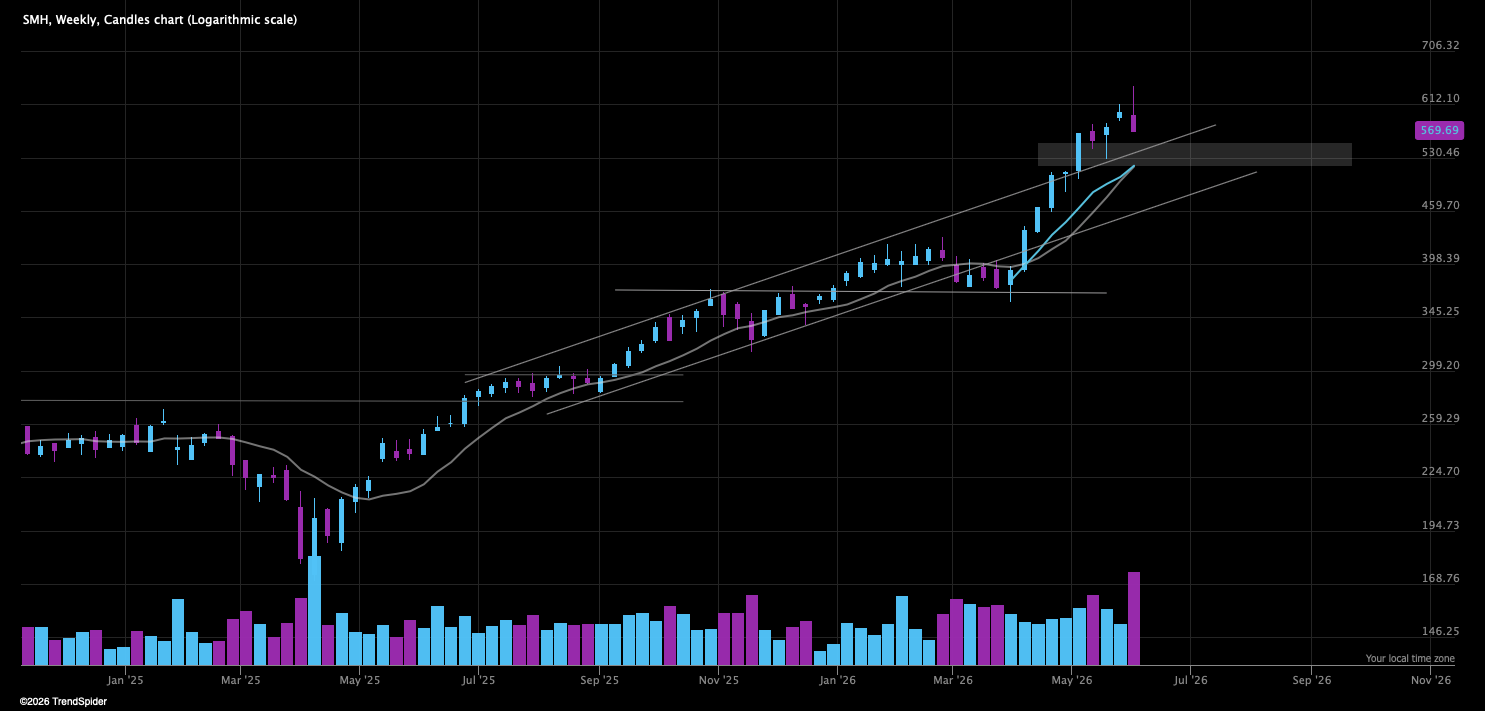
And as long as they stay above this AVWAP and the weekly 10 SMA, the uptrend is intact.
Expect choppy downwards move from here.
But interestingly small cap semis are not completely tanking relative to large cap semis. It can be because large cap semis was down a lot, so what happens from here is important.
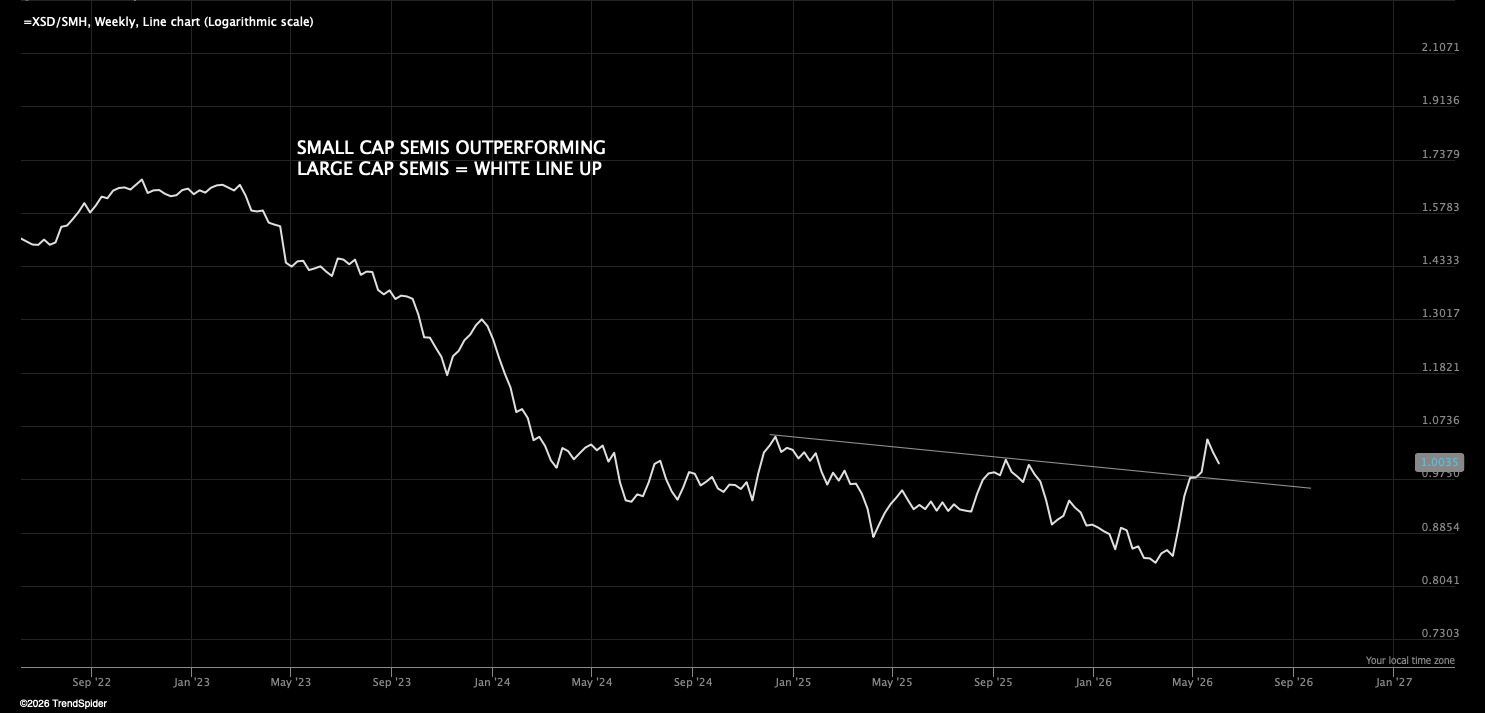
If small cap semis can continue to outperform, the underlying bid for semis is still there.
Tech Same Look — XLK
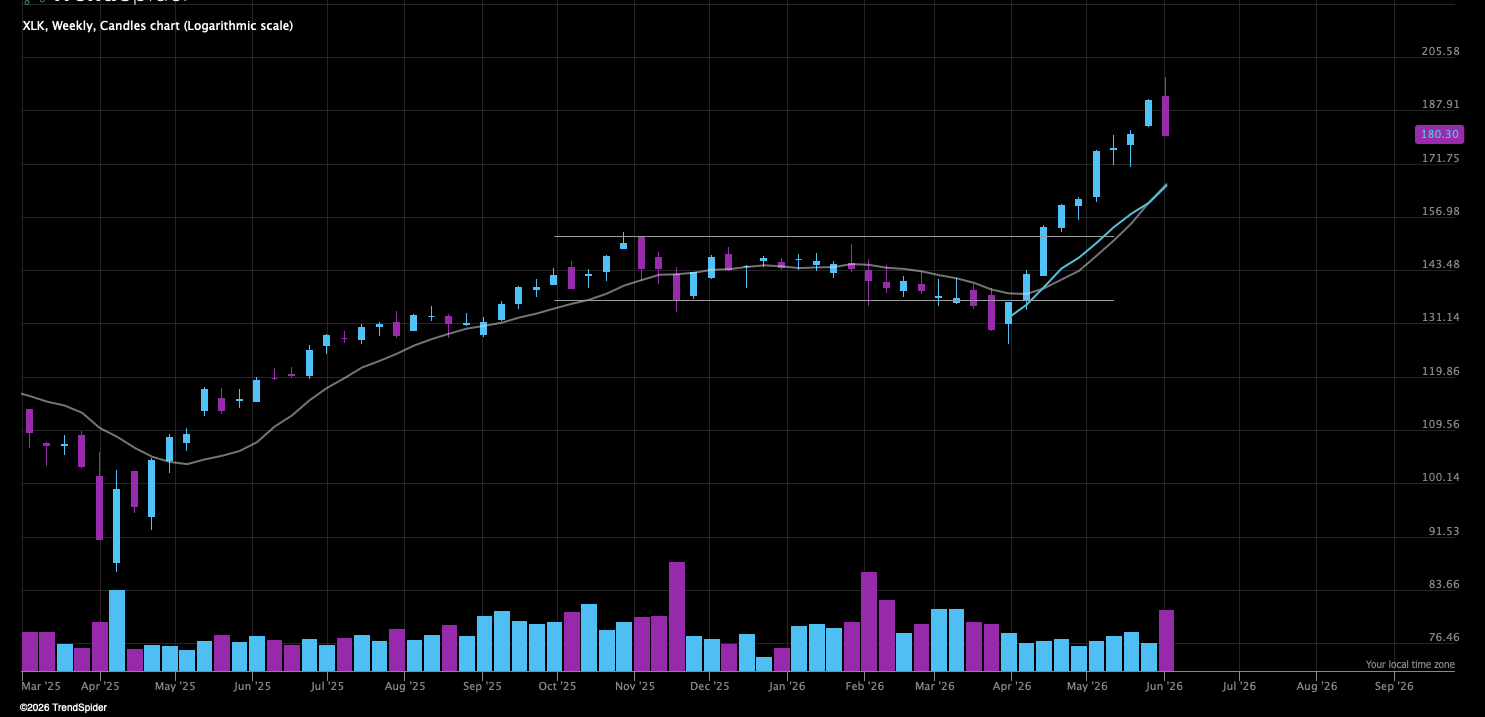
Bigger picture still fine, but weekly rejections like these will most often not resolve without more weakness, and a decline for a couple of weeks.
Setups Don’t Lie — Software
Looking at current setups, software is the clear standout theme and sector within growth. And I see a potential buying opportunity here.
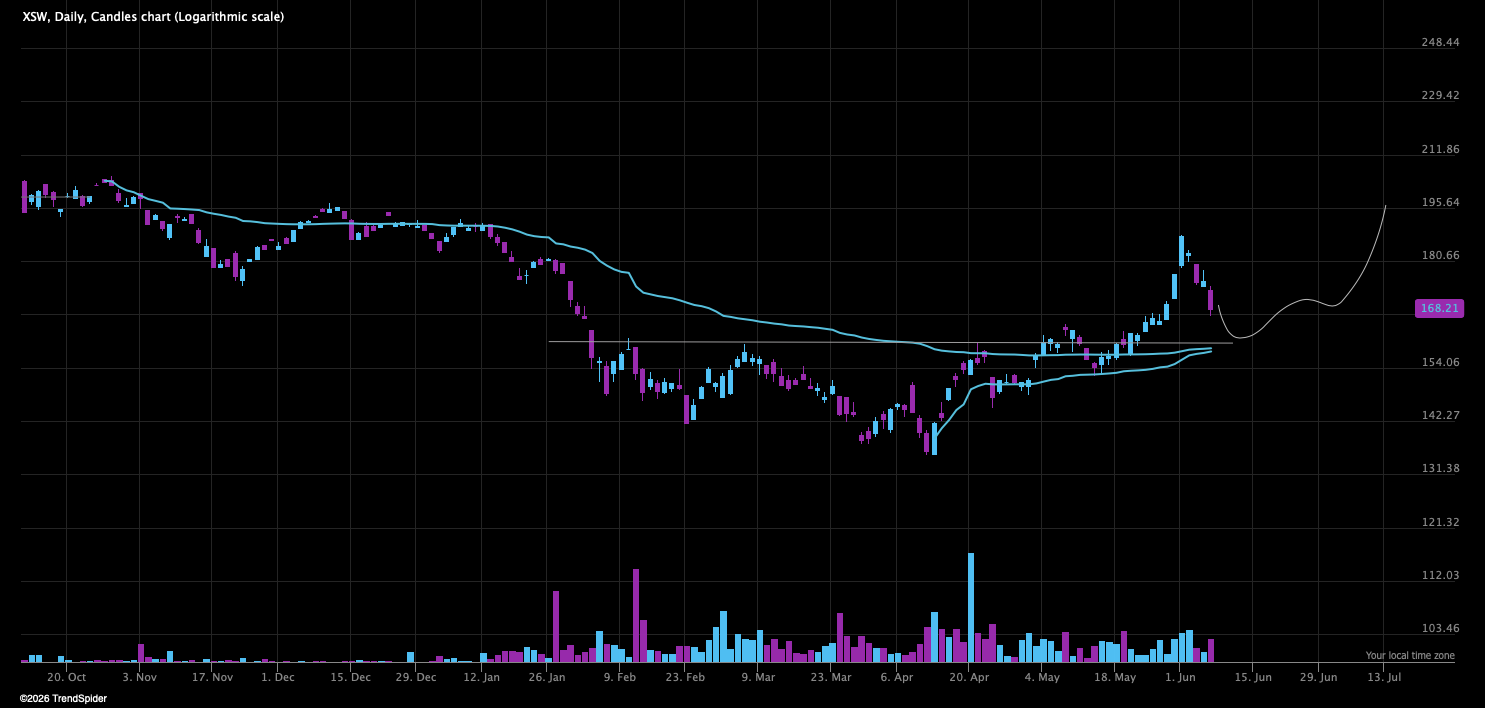
Things need to settle, but if software can backtest this base and turn, it’s very interesting.
ARKK Dumping
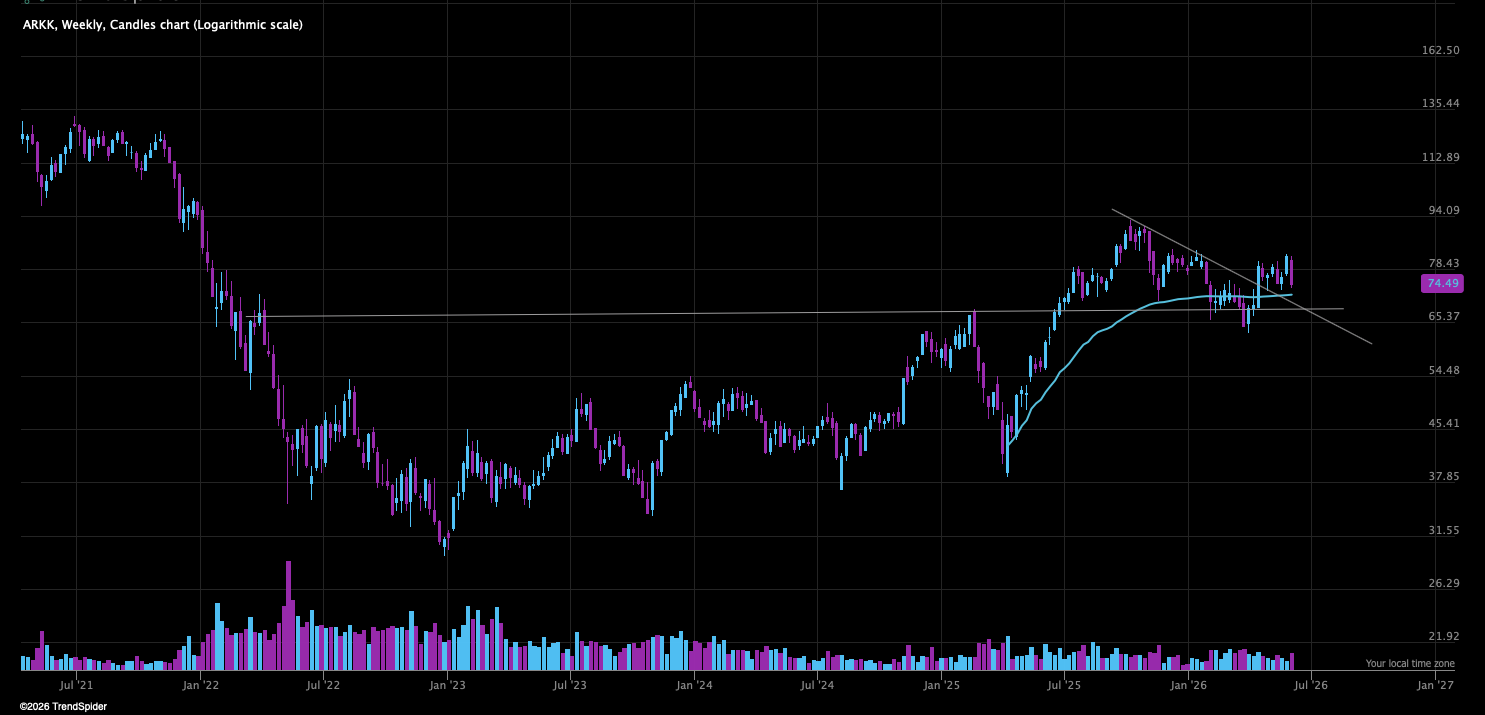
Still has room to turn, but a clear sign of the high beta unwind.
It Was A Giant Bear Flag
Major technical damage in bitcoin, last chance to turn here, but incredible weakness, this is a huge spot for bitcoin.
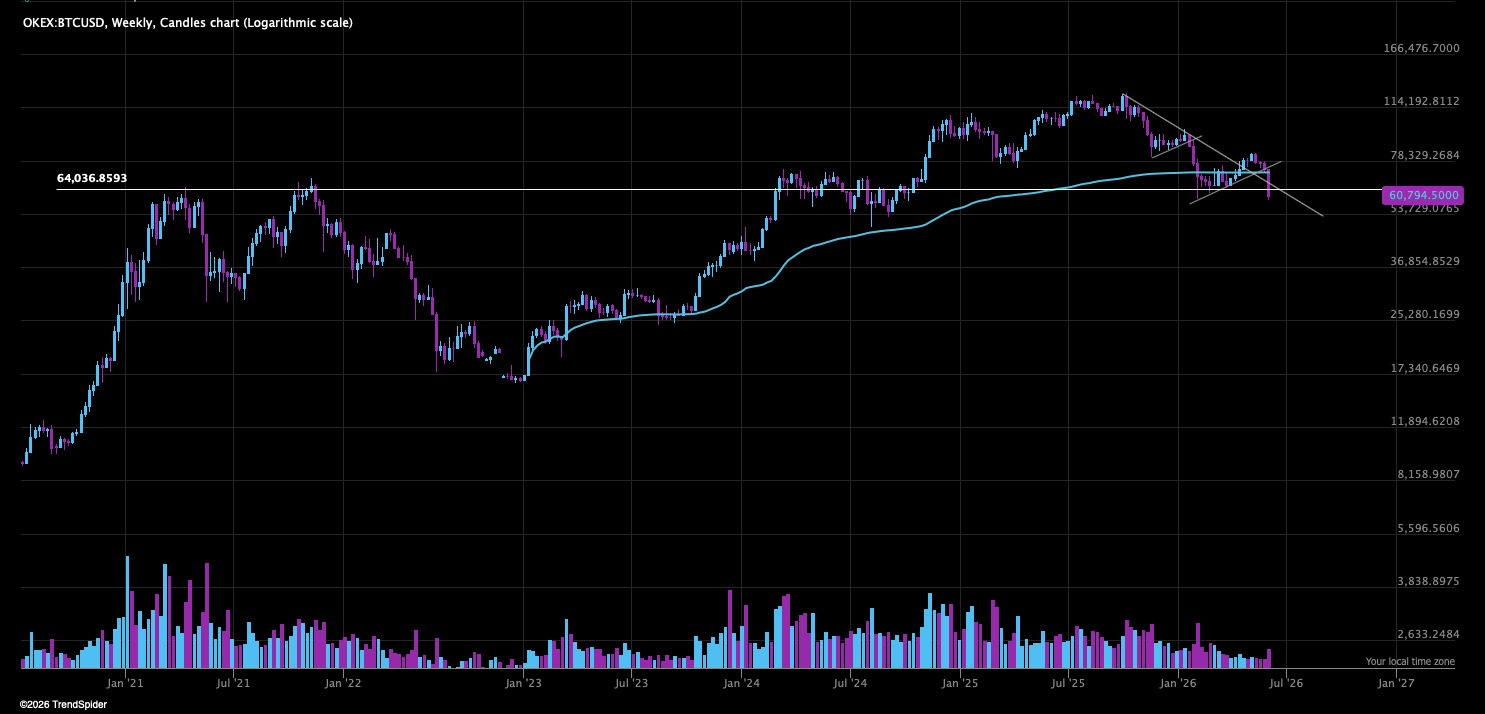
Stay away, at least until this AVWAP is reclaimed.
Gold & Silver Tanking
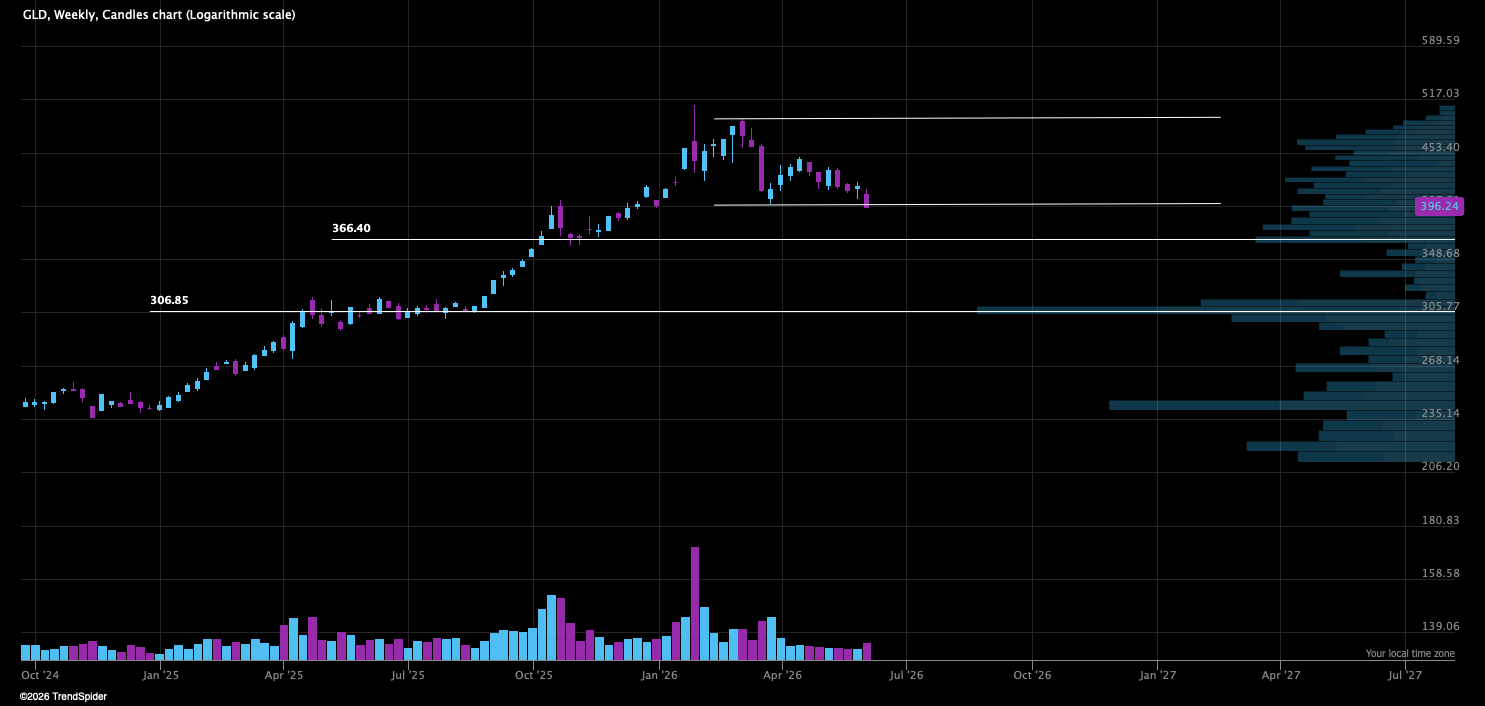
Does not look good, also stay away. Can still turn, but if we followthrough down there is some downside.
And gold is tanking maybe because of rate hikes, but likely due to liquidity. The first dump will drag everything with it, what happens after is more interesting.
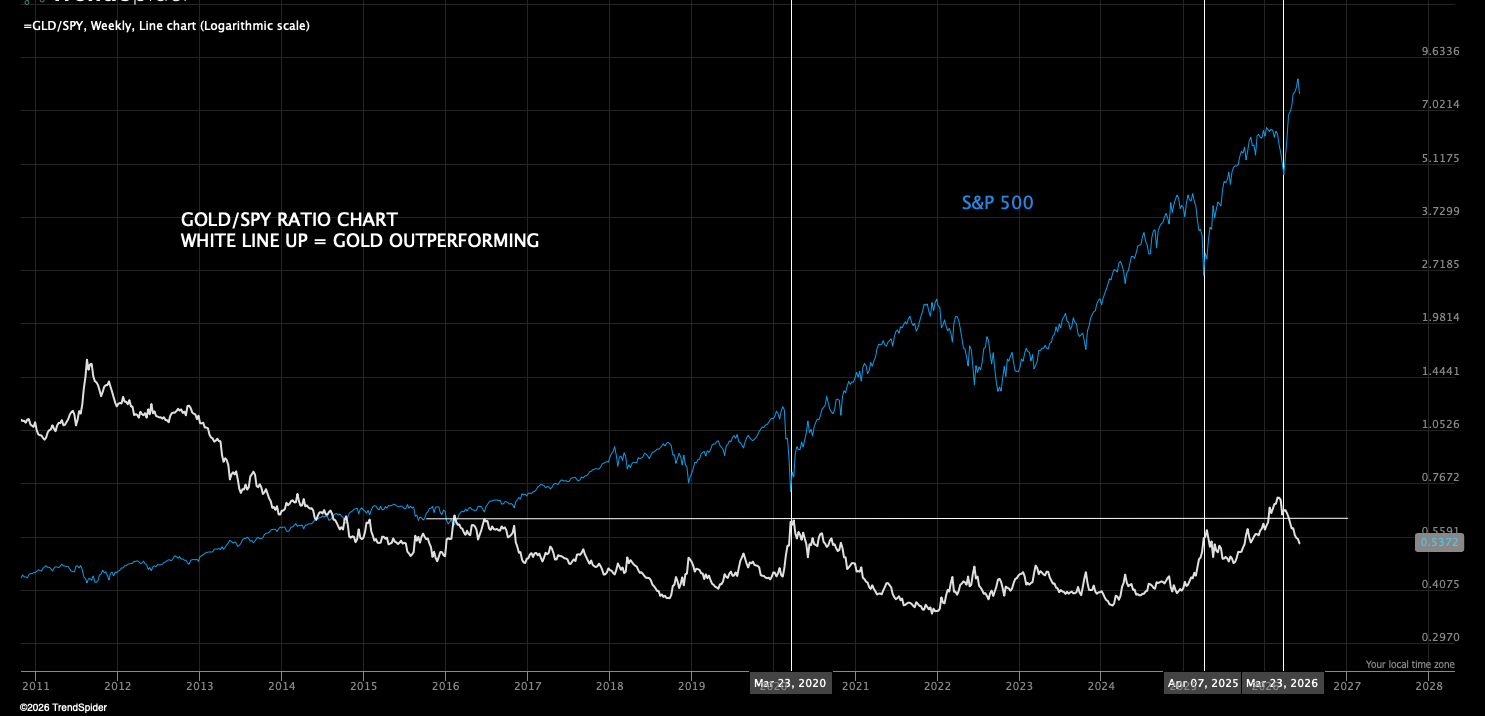
And if we get real risk off I expect gold to bid, and when gold outperforms the market excessively, we usually bottom.
The Bottomline
We are below significant moving averages and the intermediate term uptrend is under pressure
The bigger picture and trend is intact and in favor of the bulls
I expect us to undercut Friday’s low within a week and would be very surprised if we don’t — but I follow price and remain flexible
We don’t see any indications of a reliable low here, a bounce maybe but not a turn. We can turn anyway, but we see no signals we can trust currently.
Whenever volatility and weakness are still in expansion mode — it is not the time to be brave, let things settle, wait for stocks to bid and the market to calm down — the easy money isn’t here
Whenever we put in a move like we did on Friday, the regime have changed, this can mean more choppy price action, more fake breakouts and tougher trading environment short term
We also see some structural damage like Hindenburg and other bearish breadth divergences, this doesn’t mean the top is here now — but it means this can become a top and that we should continue to view the market with skepticism until market health is restored
Having said that the bigger picture is still in favor of the bulls, and I am looking at things from a bullish perspective until proven otherwise — but timing is key,
I recommend to take it very easy until we see how the market behaves, there is not rush to buy, this is the chop zone where it is very easy to lose a lot quick — don’t make that mistake, patience is key
From weakness comes opportunity for the patient and disciplined, stay sharp and focused — if you lost money you won’t win them back being careless. Lost money is lost, what you gain is new money from new trades.
I want to continue develop TSF - Analytics and this service, to make it the best platform available for our type of trading.
To do that I need to grow, every like and every restack does wonders. Without the engagement of the community — there is no growth because visibility from the algos disappears.
If you appreciate what I do, feel free to share, restack or tell some friends —it is the only way for me to grow.
Charts courtesy of SentimenTrader.com
https://sentimentrader.com/subscribe-newsletter
Charts courtesy ofwww.menthorq.com
Charts courtesy of TradingView
Charts courtesy of TrendSpider
Disclaimer:The Setup Factory and The Setup Factory Analytics are not registered investment advisors, broker-dealers, or financial planners, and are not licensed to provide investment, legal, or tax advice in any jurisdiction. All content provided through The Setup Factory Substack publication, The Setup Factory Analytics platform, and any associated communications reflects personal opinions, observations, or analytical interpretations and is provided for educational and informational purposes only.
Nothing contained herein should be construed as investment advice, a recommendation, solicitation, or offer to buy or sell any securities, financial instruments, or assets. Any analysis, data, tools, indicators, dashboards, or models provided by The Setup Factory Analytics are intended solely to support independent research and decision-making and do not constitute personalized investment advice.
Investing and trading in financial markets involves substantial risk, including the possible loss of some or all of your invested capital. Past performance is not indicative of future results. You are solely responsible for your investment decisions and for evaluating the merits and risks associated with any investment.
You should conduct your own independent research and due diligence and consult with a qualified, licensed financial advisor or other professional before making any investment decisions. By accessing or using this content or platform, you acknowledge and agree that The Setup Factory and The Setup Factory Analytics shall not be held liable for any losses, damages, or decisions arising directly or indirectly from the use of the information provided