


Every Once In A While — I Share The Full Market Analysis I Deliver Weekly To Paid Subscribers
As a free post. Today is one of those days, hope you enjoy the read!
Before We Start Let’s Admire RBLX
The best stocks are the stocks that just keep grinding up, locking everybody out.


In Last Weeks Market Analysis
We concluded that there were clear signs supporting a bullish thesis, and that we are currently in a risk on environment.

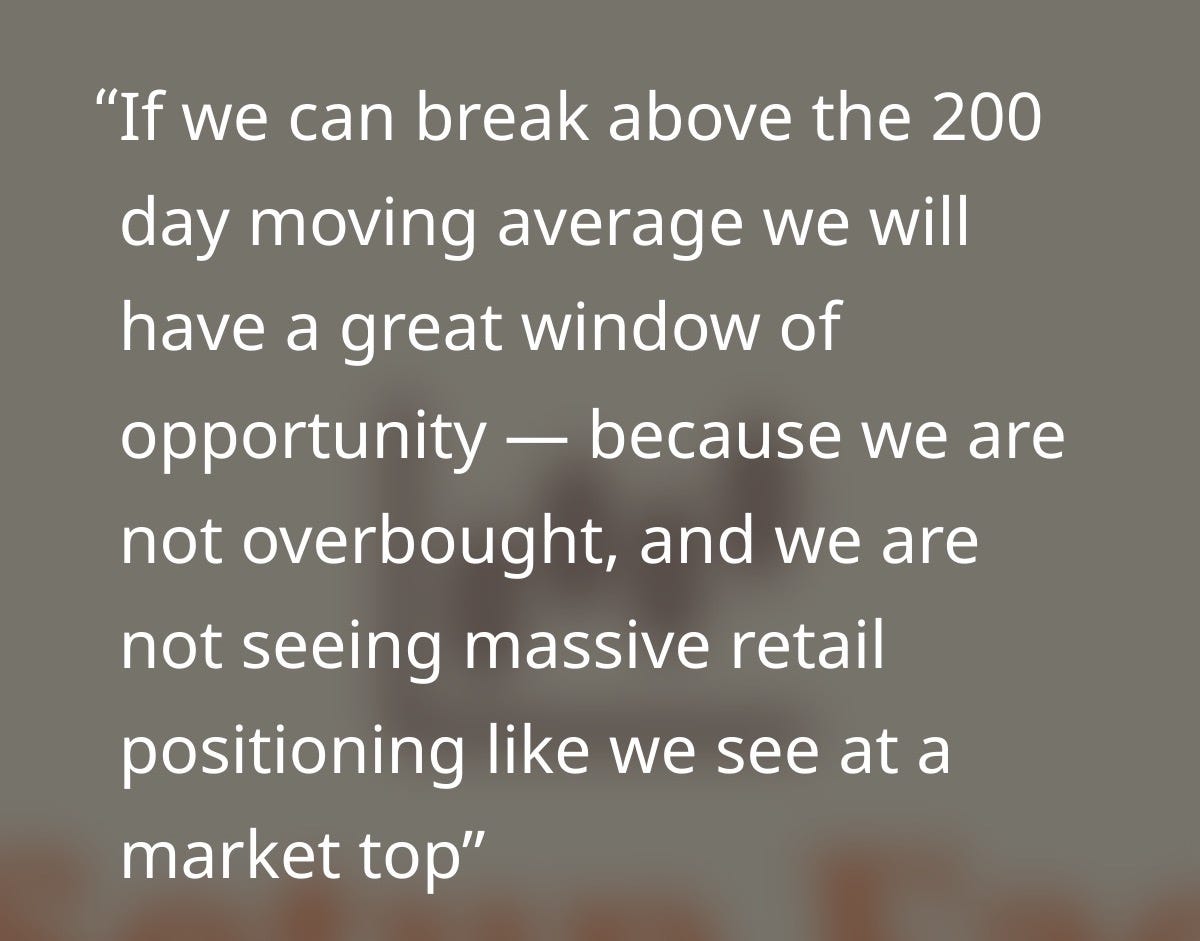
We Needed To Reclaim The 200 Day Moving Average To Gain Confidence In The Move
S&P 500 — Hold My Beer
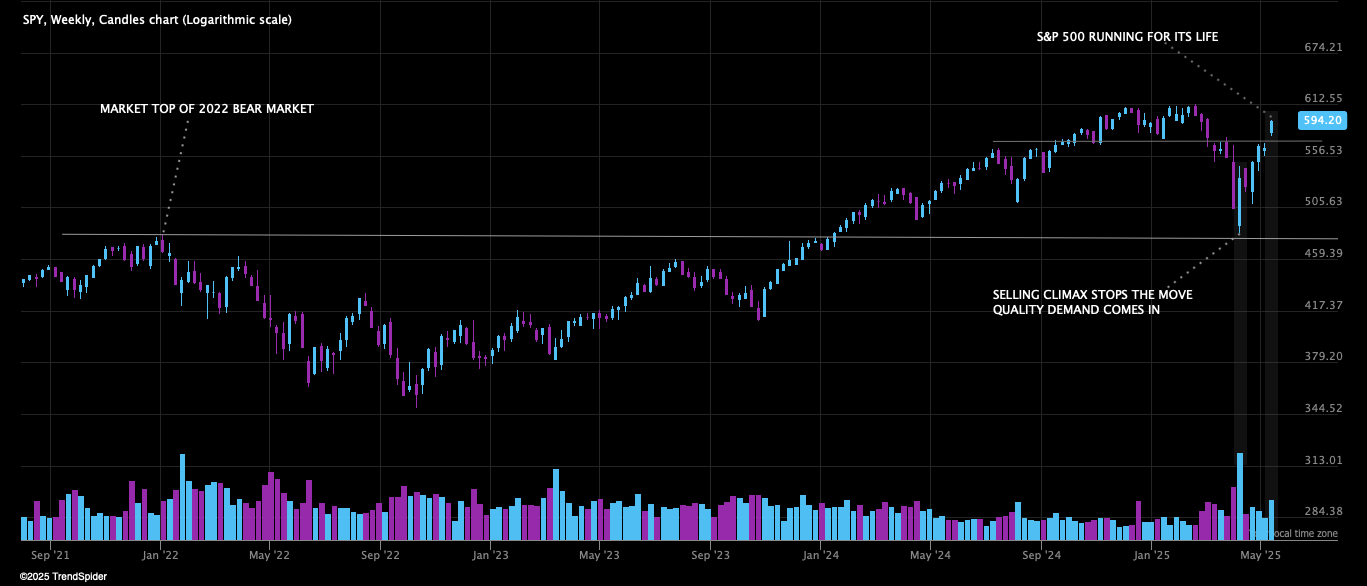
Looking At The S&P 500 When Everything Has Unfolded — A Text Book Bottoming Formation
The strength we have seen has been unreal — and we have climbed on increasing volume
In one week we cleared the 200 day and ran for our life
Clearing a significant resistance at 5900 as well
We are now less than 4% from ATH which is hard to comprehend
There Is A Risk We Will Put In A Climax Top
If the market continues to get carried away. The rate of ascent is not sustainable.

But My Main Scenario Is Better

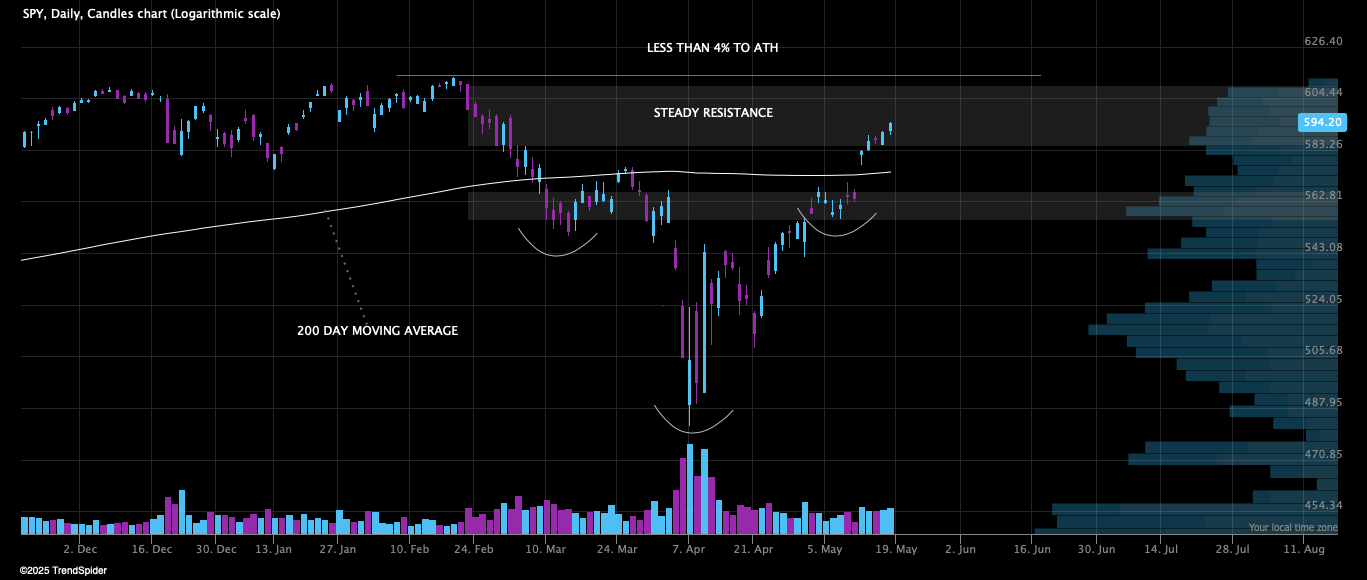
Since we now are in a major zone of steady resistance — price should consolidate here
As long as we chop around in the resistance zone — I am happy
The cue that would make us become extremely cautious, is if we decline into the danger zone — the level where we gapped up above the 200 day is now a big level to watch as support
And If we have any day traders among us, I can recommend my friend at ES daily — he gives you the levels of SPX everyday.

Today We Are Going To Look At
Breadth observations
MAGS
An extreme but a healthy rally?
VIX and smart money bets on VIX direction
Smart money and dumb money positioning
Hedgefund exposure to equities, and what it tells us of the market direction going forward
Smart money hedgers positioning showing a big change of character this week — giving clues of the market direction in the short term
Moody´s downgrading
We Are Getting Overheated In The Medium Term
Looking at medium term breadth readings, we are close to levels where we usually get some kind of cool off or decline.
But in comparison with a normal bullmarket, when we get these kind of readings in a reversal from a bear market — we usually continue our advance up swiftly.
Nasdaq Composite Stocks Above The 50 Day Moving Average

If we compare with the COVID-19 crash and the 2022 bear market.
There Are Much More Fuel In The Tank
When looking at longer term breadth readings. Less than 50% of stocks are above the 200 day moving average — meaning more than half of stocks in the market are still in a longterm downtrend.
As a comparison, the highest reading before we topped in 2022 was 90%. This chart also shows how obviously unhealthy the market was before we topped in 2022.
A major warning sign is declining breadth with an increasing index.
This is something we will notice in the future in our weekly analysis — declining market participation with a rising market, is usually an imminent market top.
% Of Stocks Above The 200 Day Moving Average
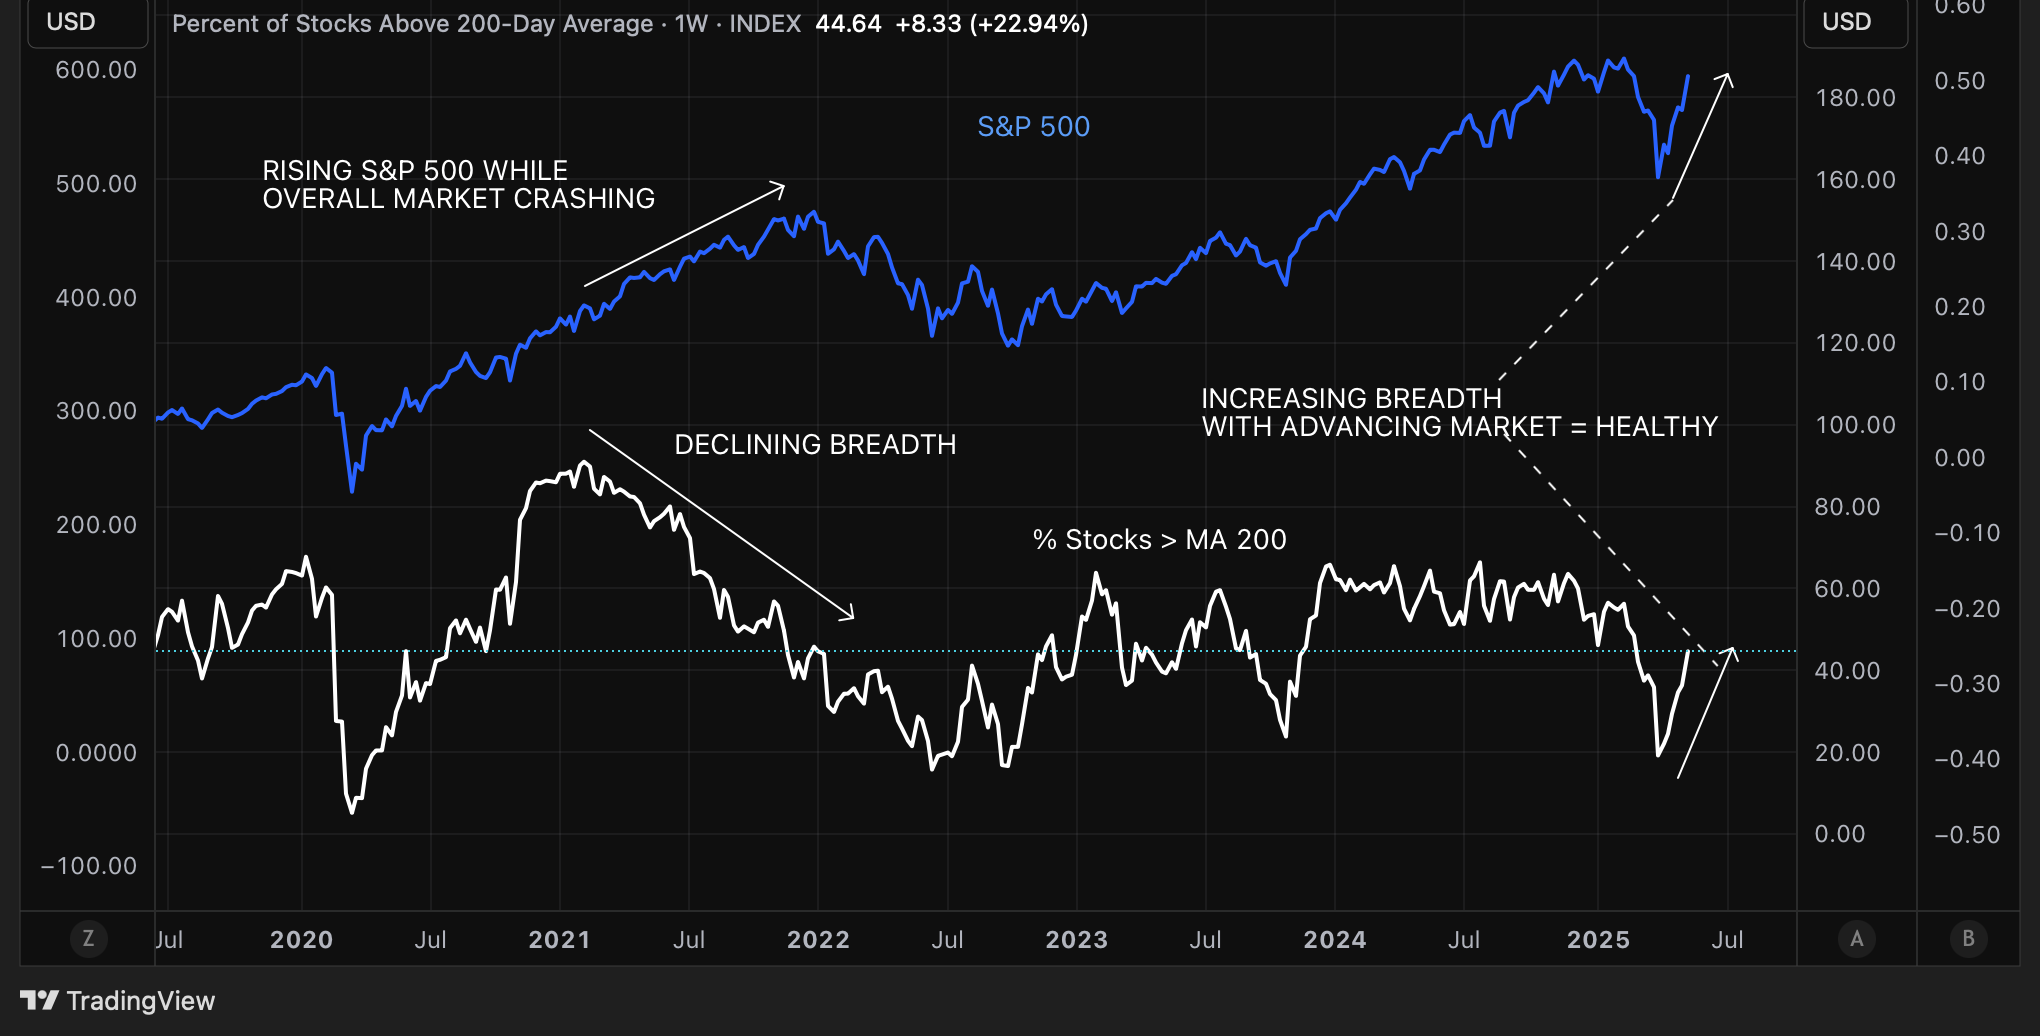
We are not seeing any indication of that at the moment.
The Breadth Divergence Before The 2022 Market Top — A MAGS Story
Since the S&P 500 is a weighted index — MAGS accounts for more than 1/3 of its movements. Therefore the S&P 500 can advance, while the broad overall market is declining.
I firmly believe that we still need MAGS to advance, for the overall sentiment and market to remain healthy.
And MAGS Are Showing Serious Life For The First Time In A While

It will be very important for the overall market that MAGS remain in a longterm uptrend.
An Extreme — But A Healthy Rally
In the sense that it is fueled by broad market participation. I am still not seeing any signs of a narrowing rally, which would be a first warning sign.
Evidenced by that broad breadth momentum indicators such as the Advance/Decline line and McClellan summation are making new highs.
The underlying strength in the market is not fading - yet
S&P 500 Together With The A/D-Line And McClellan Summation
(Source: SentimenTrader.com)

Equity Hedging Index Melting Down — Short Term Bullish
Last week I showed you that smart money hedgers started decreasing their hedging against stocks — which we interpreted as an early sign of an imminent bullrun. We also concluded that we want a swift meltdown in hedging to gain confidence in the advance
Well this week we got exactly that, which is short to medium term bullish.

In the 2022 bear market rallies they never decreased their hedges this swiftly. However they did it when the market finally bottomed.
But There Are Some Emerging Signs Of Worry
VIX Is Making New Lows And Smart Money Are Still Net Short VIX
Which is great and exactly what we want to see — A low volatility environment is a bullish environment.
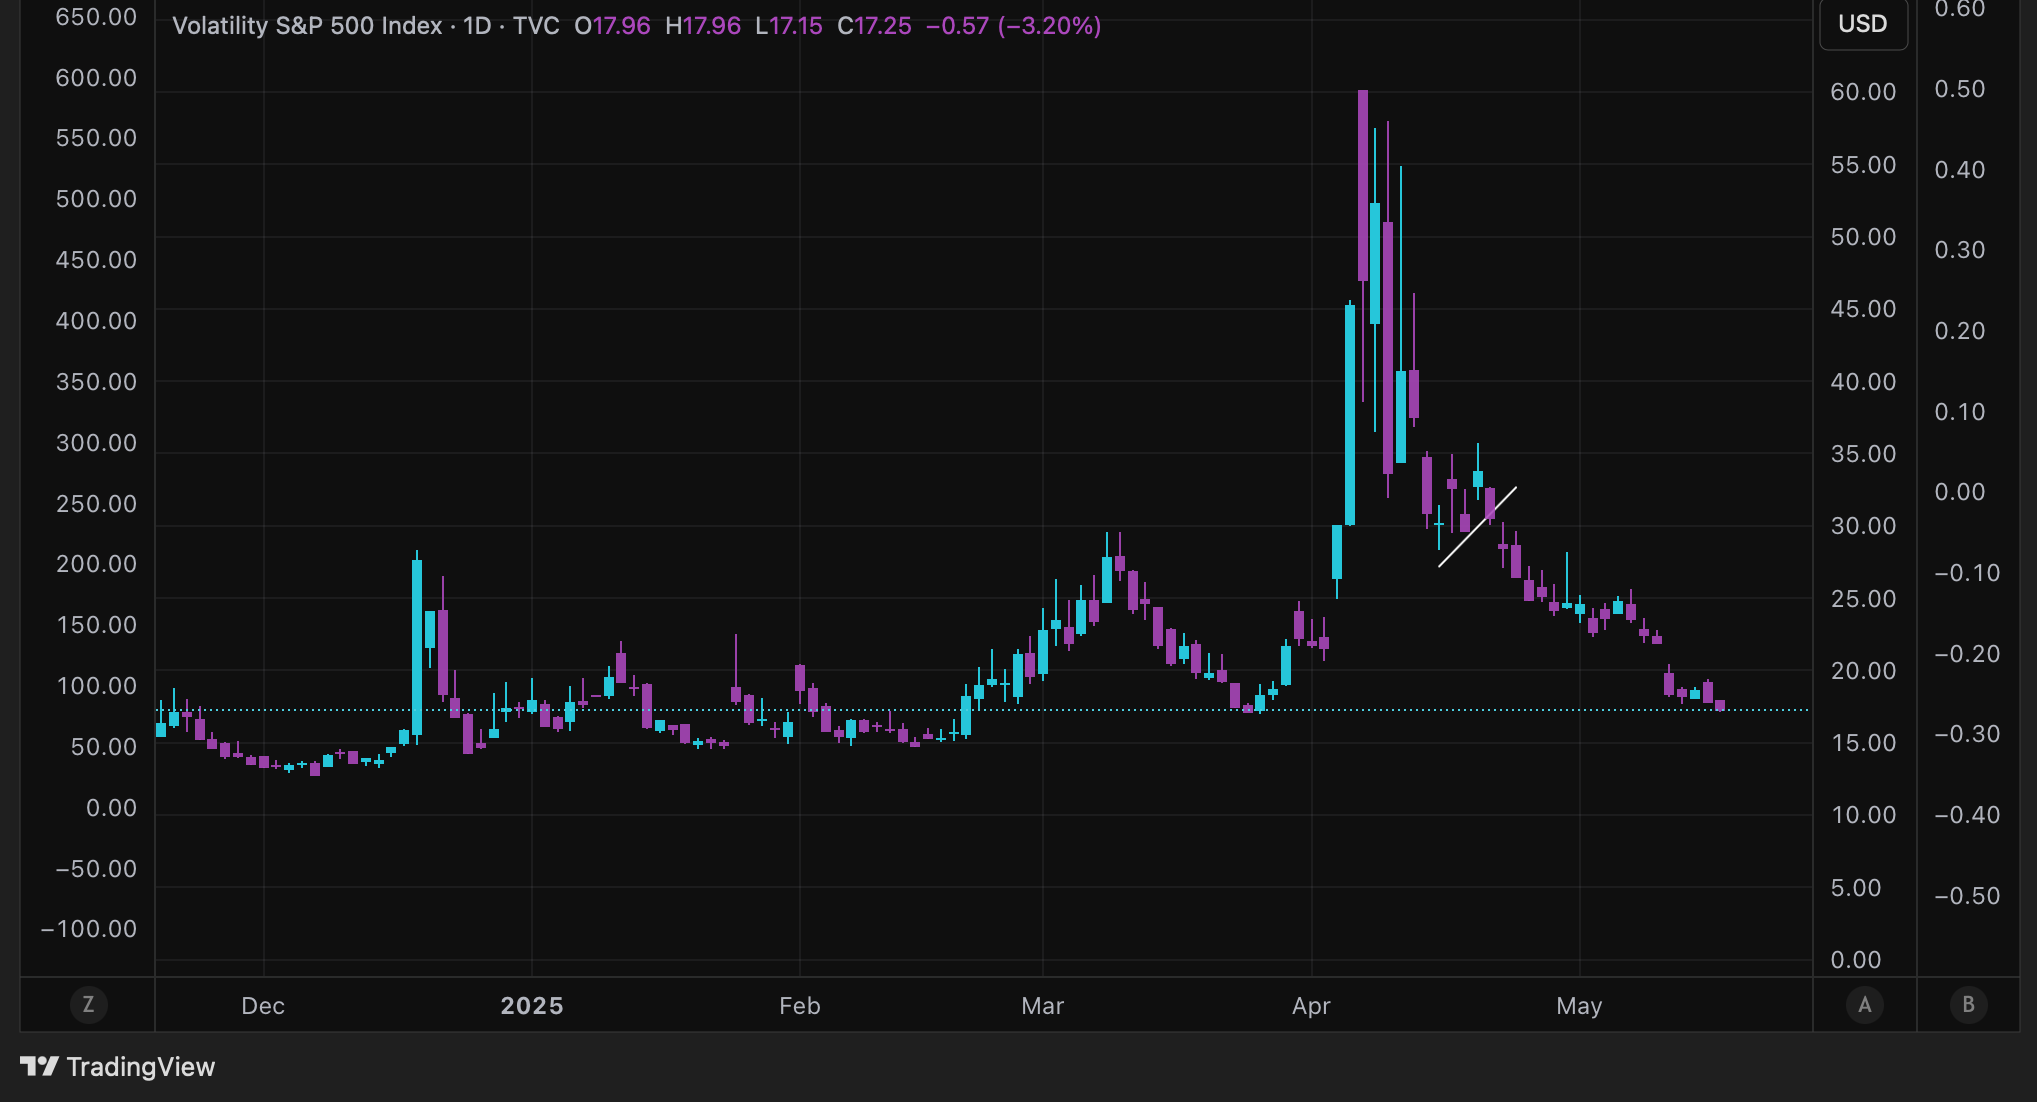
But smart money are decreasing their short in VIX, although still net short.
If we start seeing them being aggressively long VIX, that would be an early warning sign — something we will monitor every week.
Smart Money/Dumb Money Confidence Spread Is Widening
What we usually see in bottoms is smart money confidence spiking and dumb money confidence plummeting — and this is exactly what we saw this time as well.
As we advance, it is normal for smart money to become more bearish and dumb money to gain confidence — this is a sign of an overall positive sentiment.
But as the spread between the two widens or when dumb money confidence spikes — that is usually a sign of an imminent pullback.
And We Are Getting There
(Source: SentimenTrader.com)

I want to emphasize that a pullback doesn’t mean a new bear market, it is simply a sign that we are overheating in the short term.
During bull markets, there can be a long periods of wide smart money/dumb money confidence spread. But when either one hits an extreme, like dumb money is now, it is still a sign of an increased risk for a pullback.
Hedge fund Exposure To Equities Increasing —While Their Exposure To Bonds Is At Historical Lows
Hedgefunds are smart money — but they also heavily influence the stock market due to the immense size of their capital.
Hedge funds allocate their capital mostly in either stocks or bonds. There are other assets like gold, dollar and cash — but the major allocation is between stocks or bonds.
A decreasing allocation to bonds, favor stock price increase simply due to the money flowing into equities. When they are overly exposed to stocks, that is however a sign of worry — because it may lead to heavy outflow from the stock market.
When we see a very low allocation to bonds in combination with a very high exposure to stocks — that is probably a sign of an incoming stock market decline.
We are not there yet, but we are approaching that point. Capital will eventually flow from the over owned asset class, soon to be stocks, to the under owned asset class — which is bonds.
(Source: SentimenTrader.com)

This relationship is more complex and would need a post by itself. But as you can see in the chart, hedge funds were underexposed to stocks going into this decline. And they have now increased their exposure to the highest level since October-24.
This can be interpreted as bullish, since they are smart money and thus believe in stock market advance.
However the very low exposure to bonds is still a concern, and can put pressure on the stock market due to capital flow into bonds.
Finally Moody´s Downgrade Is Probably A Non-event
And should be priced in by how the bond market has acted lately. If anything it can be an excuse for an expected short term pullback in the market — which we would need to make this a sustainable advance.
The Bottomline
There is still a clear risk on and bullish bias in the market, further emphasized by the reclaim of the 200 day moving average
We see no major red flags in smart money positioning or hedgers activity alerting us of an imminent crash
We see no red flags in the sense of a narrowing rally with fading momentum and breadth
We are short term overheated and should pullback — it will be key that the pullback is orderly and that we do not violate the 200 day moving average
We will continue to monitor the actions of leading stocks — they are the ones that will give us the clues of a sudden change in sentiment
Block out the noise and focus on what your stocks are doing
Buying the dip should work better than buying strength in the very short term due to overbought conditions
Hope this helps and thank you for reading, if you liked it feel free to share it so the substack can grow.
Charts courtesy of SentimenTrader.com
https://sentimentrader.com/subscribe-newsletter
Charts courtesy of TradingView
Charts courtesy of TrendSpider
Disclaimer: The Setup Factory is not licensed to give any investment advice. The content provided in this email and from this Substack-account is my own thoughts and ideas about the stock market. It is for educational purposes only and should not be considered as any form of investment advice. Do not invest in any stock based solely on the information provided here. Trading stocks is highly speculative and involves a high degree of risk of loss. You could lose some or all of your money. You should conduct your own research and due diligence in any investment you do, to verify any information provided.